Workshops for using curated packages.
This is the multi-page printable view of this section. Click here to print.
Curated Packages Workshop
1 - Prometheus use cases
Important
- To install Prometheus package, please follow the installation guide.
- To view Prometheus package complete configuration options and their default values, please refer to the prometheus package spec.
1.1 - Prometheus with Grafana
This tutorial demonstrates how to config the Prometheus package to scrape metrics from an EKS Anywhere cluster, and visualize them in Grafana.
This tutorial walks through the following procedures:
Install the Prometheus package
The Prometheus package creates two components by default:
- Prometheus-server, which collects metrics from configured targets, and stores the metrics as time series data;
- Node-exporter, which exposes a wide variety of hardware- and kernel-related metrics for prometheus-server (or an equivalent metrics collector, i.e. ADOT collector) to scrape.
The prometheus-server is pre-configured to scrape the following targets at 1m interval:
- Kubernetes API servers
- Kubernetes nodes
- Kubernetes nodes cadvisor
- Kubernetes service endpoints
- Kubernetes services
- Kubernetes pods
- Prometheus-server itself
If no config modification is needed, a user can proceed to the Prometheus installation guide .
Prometheus Package Customization
In this section, we cover a few frequently-asked config customizations. After determining the appropriate customization, proceed to the Prometheus installation guide to complete the package installation. Also refer to Prometheus package spec for additional config options.
Change prometheus-server global configs
By default, prometheus-server is configured with evaluation_interval: 1m, scrape_interval: 1m, scrape_timeout: 10s. Those values can be overwritten if preferred / needed.
The following config allows the user to do such customization:
apiVersion: packages.eks.amazonaws.com/v1alpha1
kind: Package
metadata:
  name: generated-prometheus
  namespace: eksa-packages-<cluster-name>
spec:
  packageName: prometheus
  config: |
    server:
      global:
        evaluation_interval: "30s"
        scrape_interval: "30s"
        scrape_timeout: "15s"
Run prometheus-server as statefulSets
By default, prometheus-server is created as a deployment with replicaCount equals to 1. If there is a need to increase the replicaCount greater than 1, a user should deploy prometheus-server as a statefulSet instead. This allows multiple prometheus-server pods to share the same data storage.
The following config allows the user to do such customization:
apiVersion: packages.eks.amazonaws.com/v1alpha1
kind: Package
metadata:
  name: generated-prometheus
  namespace: eksa-packages-<cluster-name>
spec:
  packageName: prometheus
  config: |
    server:
      replicaCount: 2
      statefulSet:
        enabled: true
Disable prometheus-server and use node-exporter only
A user may disable the prometheus-server when:
- they would like to use node-exporter to expose hardware- and kernel-related metrics, while
- they have deployed another metrics collector in the cluster and configured a remote-write storage solution, which fulfills the prometheus-server functionality (check out the ADOT with Amazon Managed Prometheus and Amazon Managed Grafana workshop to learn how to do so).
The following config allows the user to do such customization:
    apiVersion: packages.eks.amazonaws.com/v1alpha1
    kind: Package
    metadata:
      name: generated-prometheus
      namespace: eksa-packages-<cluster-name>
    spec:
      packageName: prometheus
      config: |
        server:
          enabled: false
Disable node-exporter and use prometheus-server only
A user may disable the node-exporter when:
- they would like to deploy multiple prometheus-server packages for a cluster, while
- deploying only one or none node-exporter instance per node.
The following config allows the user to do such customization:
    apiVersion: packages.eks.amazonaws.com/v1alpha1
    kind: Package
    metadata:
      name: generated-prometheus
      namespace: eksa-packages-<cluster-name>
    spec:
      packageName: prometheus
      config: |
        nodeExporter:
          enabled: false
Prometheus Package Test
To ensure the Prometheus package is installed correctly in the cluster, a user can perform the following tests.
Access prometheus-server web UI
Port forward Prometheus to local host 9090:
export PROM_SERVER_POD_NAME=$(kubectl get pods --namespace <namespace> -l "app=prometheus,component=server" -o jsonpath="{.items[0].metadata.name")
kubectl port-forward $PROM_SERVER_POD_NAME -n <namespace> 9090
Go to http://localhost:9090 to access the web UI.
Run sample queries
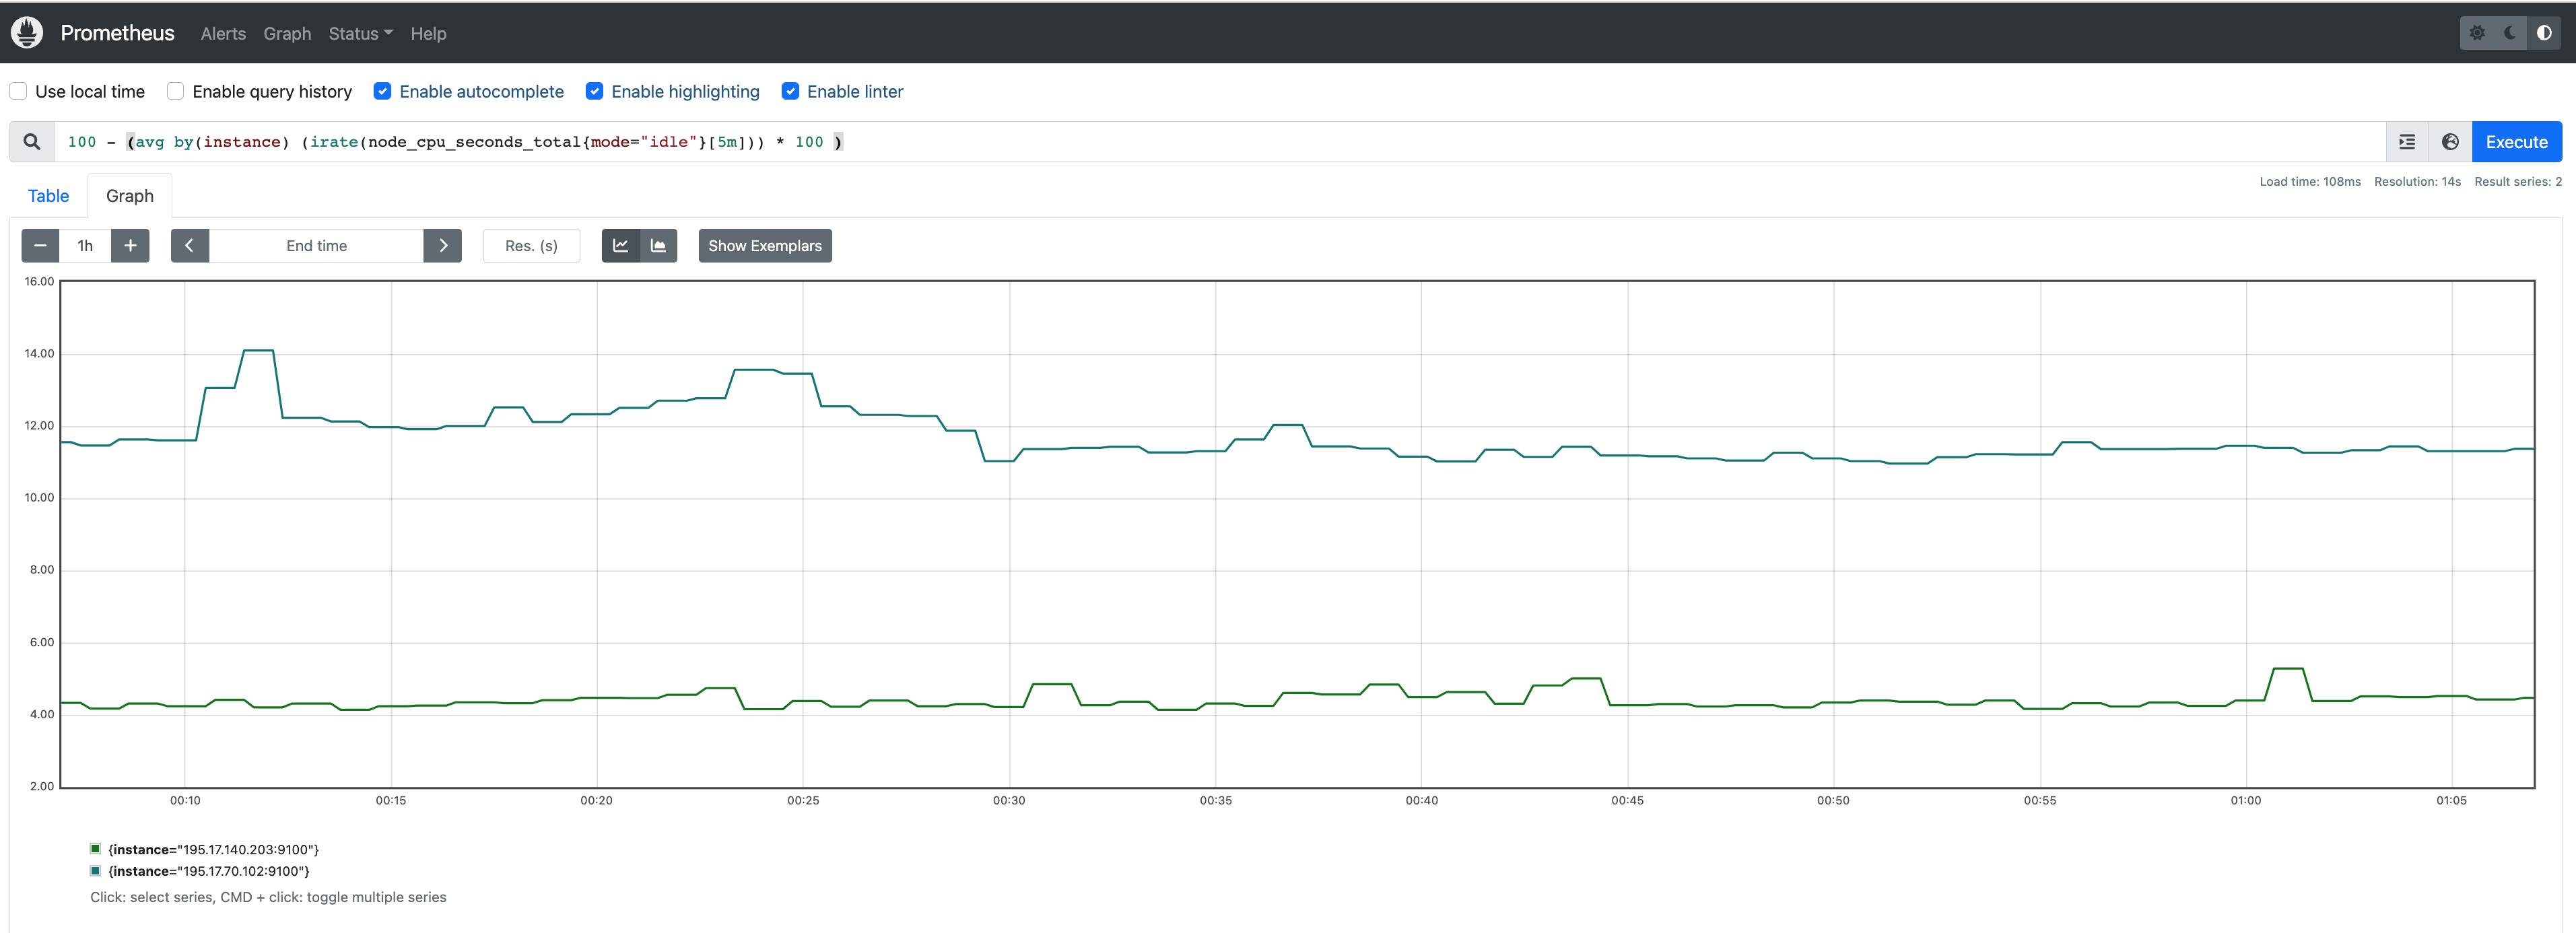
Run sample queries in Prometheus web UI to confirm the targets have been configured properly. For example, a user can run the following query to obtain the CPU utilization rate by node.
100 - (avg by(instance) (irate(node_cpu_seconds_total{mode="idle"}[5m])) * 100 )
The output will be displayed on the Graph tab.
Install Grafana helm charts
A user can install Grafana in the cluster to visualize the Prometheus metrics. We used the Grafana helm chart as an example below, though other deployment methods are also possible.
-
Get helm chart repo info
helm repo add grafana https://grafana.github.io/helm-charts helm repo update -
Install the helm chart
helm install my-grafana grafana/grafana
Set up Grafana dashboards
Access Grafana web UI
-
Obtain Grafana login password:
kubectl get secret --namespace default my-grafana -o jsonpath="{.data.admin-password}" | base64 --decode; echo -
Port forward Grafana to local host
3000:export GRAFANA_POD_NAME=$(kubectl get pods --namespace default -l "app.kubernetes.io/name=grafana,app.kubernetes.io/instance=my-grafana" -o jsonpath="{.items[0].metadata.name}") kubectl --namespace default port-forward $GRAFANA_POD_NAME 3000 -
Go to http://localhost:3000 to access the web UI. Log in with username
admin, and password obtained from the Obtain Grafana login password in step 1 above.
Add Prometheus data source
-
Click on the
Configurationsign on the left navigation bar, selectData sources, then choosePrometheusas theData source.
-
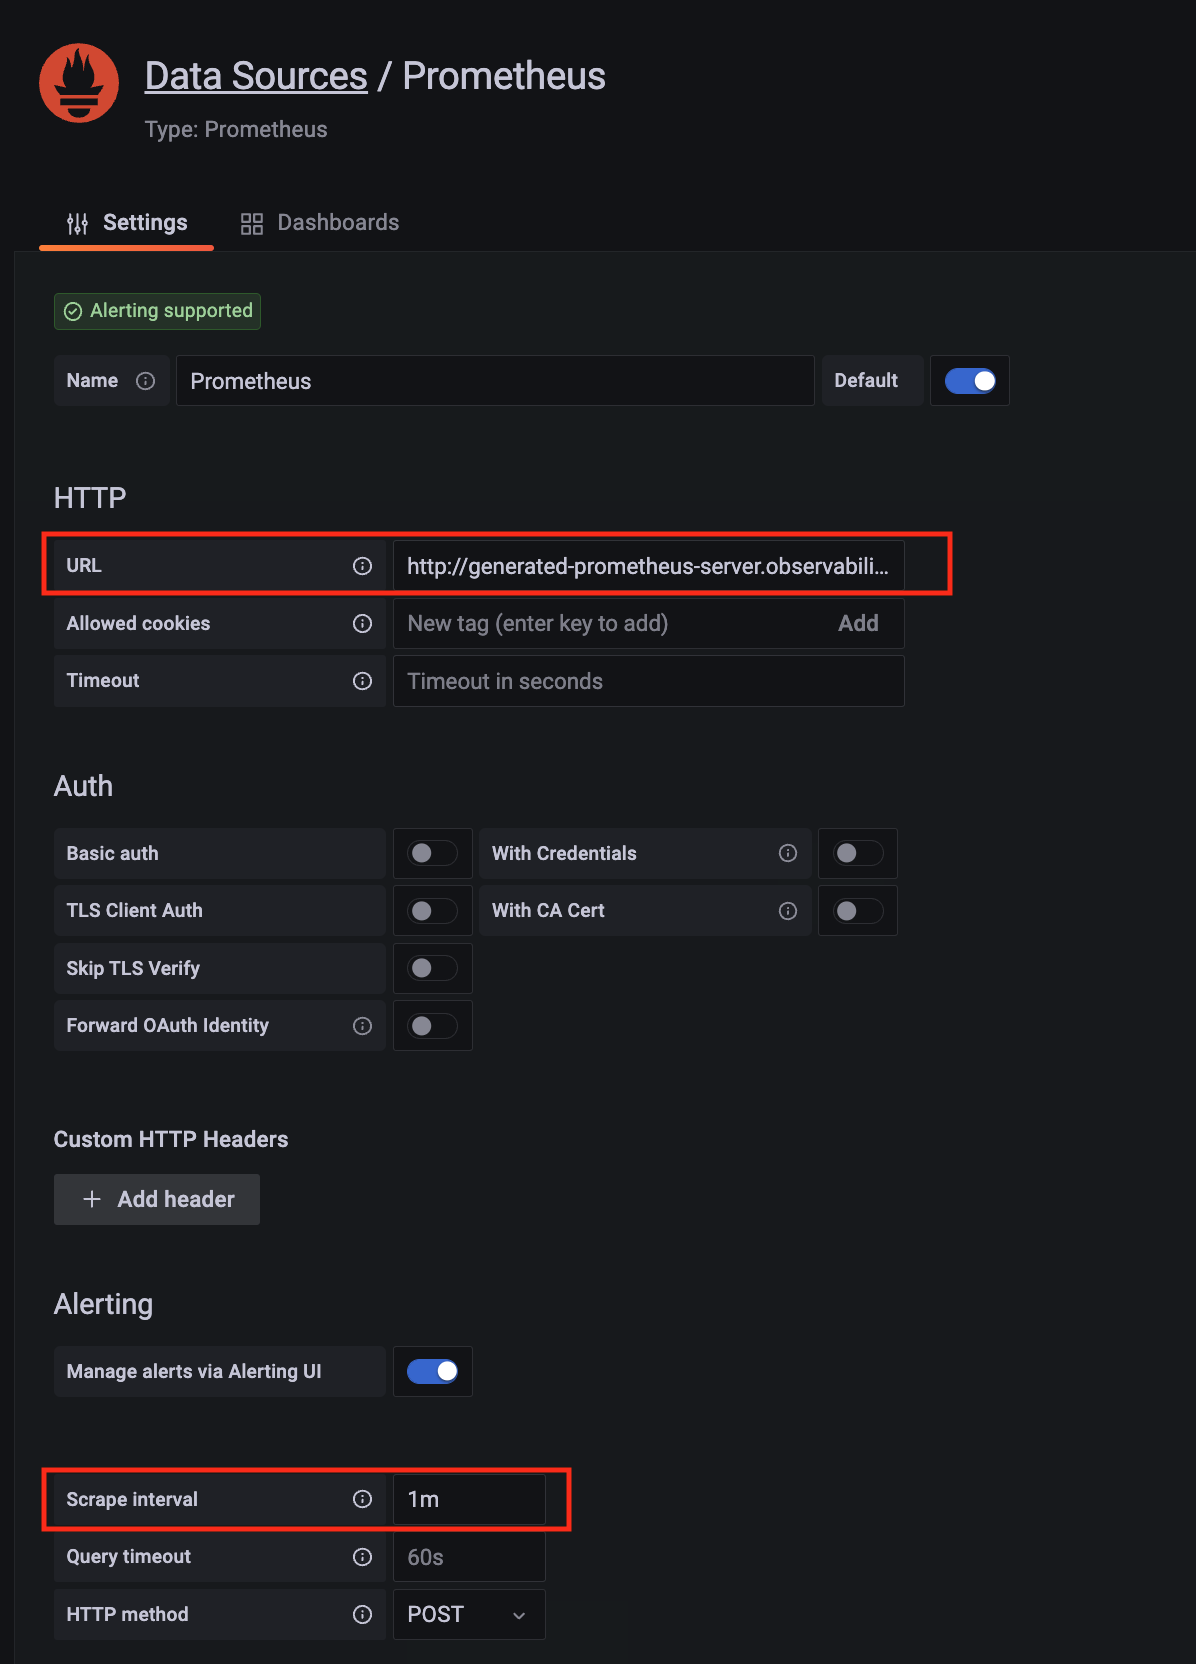
Configure Prometheus data source with the following details:
- Name:
Prometheusas an example. - URL:
http://<prometheus-server-end-point-name>.<namespace>:9090. If the package default values are used, this will behttp://generated-prometheus-server.observability:9090. - Scrape interval:
1mor the value specified by user in the package config. - Select
Save and test. A notificationdata source is workingshould be displayed.
- Name:
Import dashboard templates
-
Import a dashboard template by hovering over to the
Dashboardsign on the left navigation bar, and click onImport. Type315in theImport via grafana.comtextbox and selectImport. From the dropdown at the bottom, selectPrometheusand selectImport.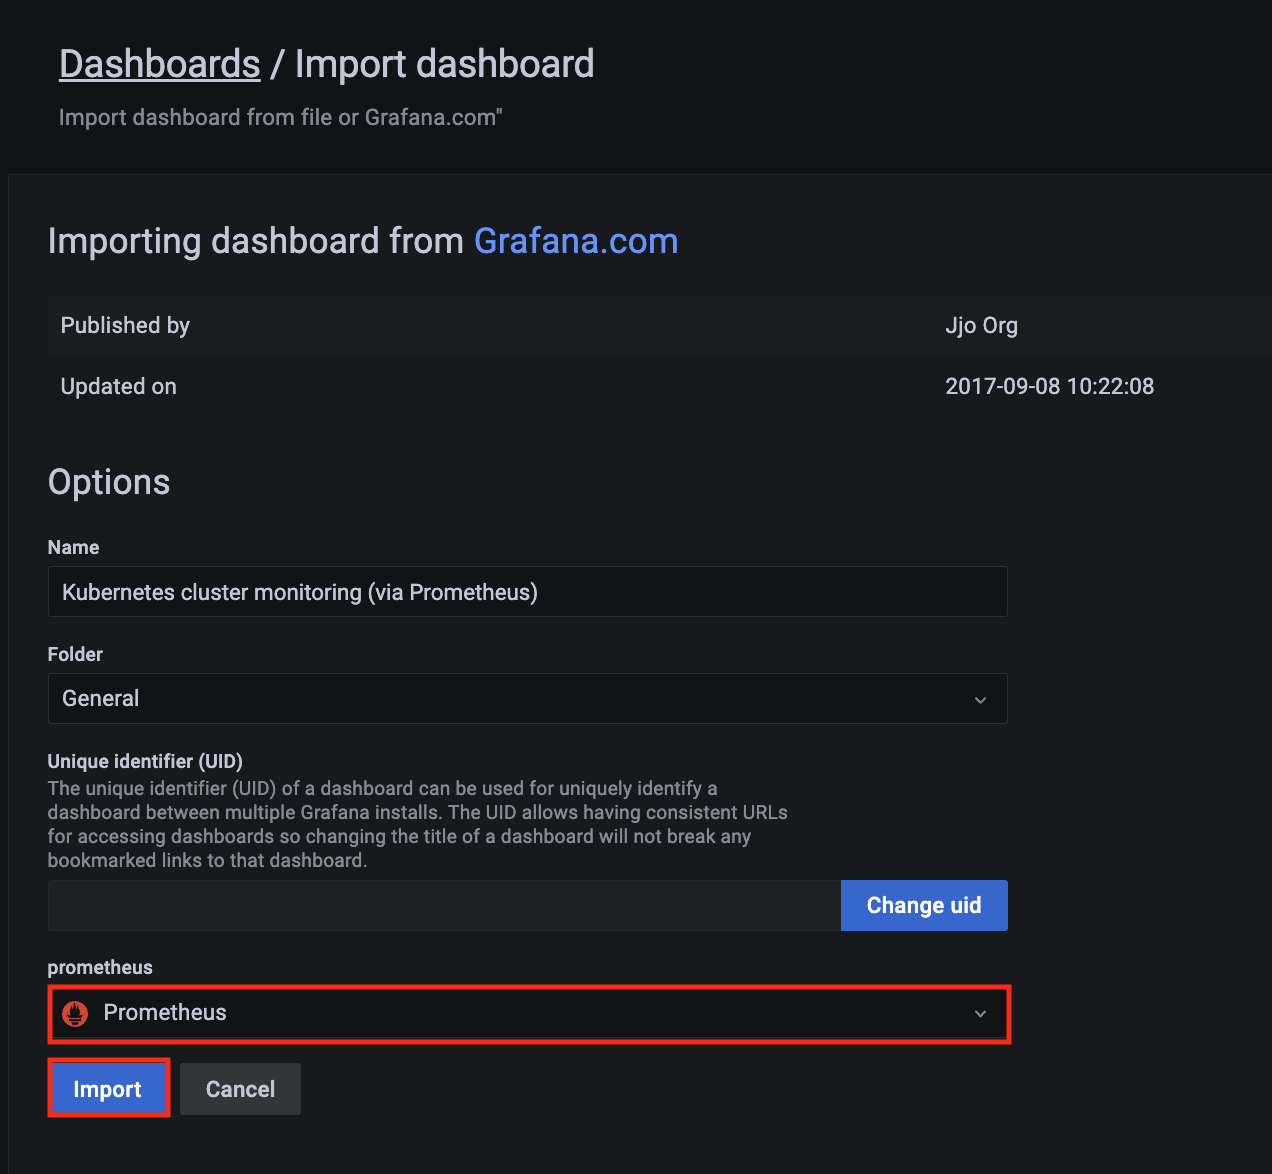
-
A
Kubernetes cluster monitoring (via Prometheus)dashboard will be displayed.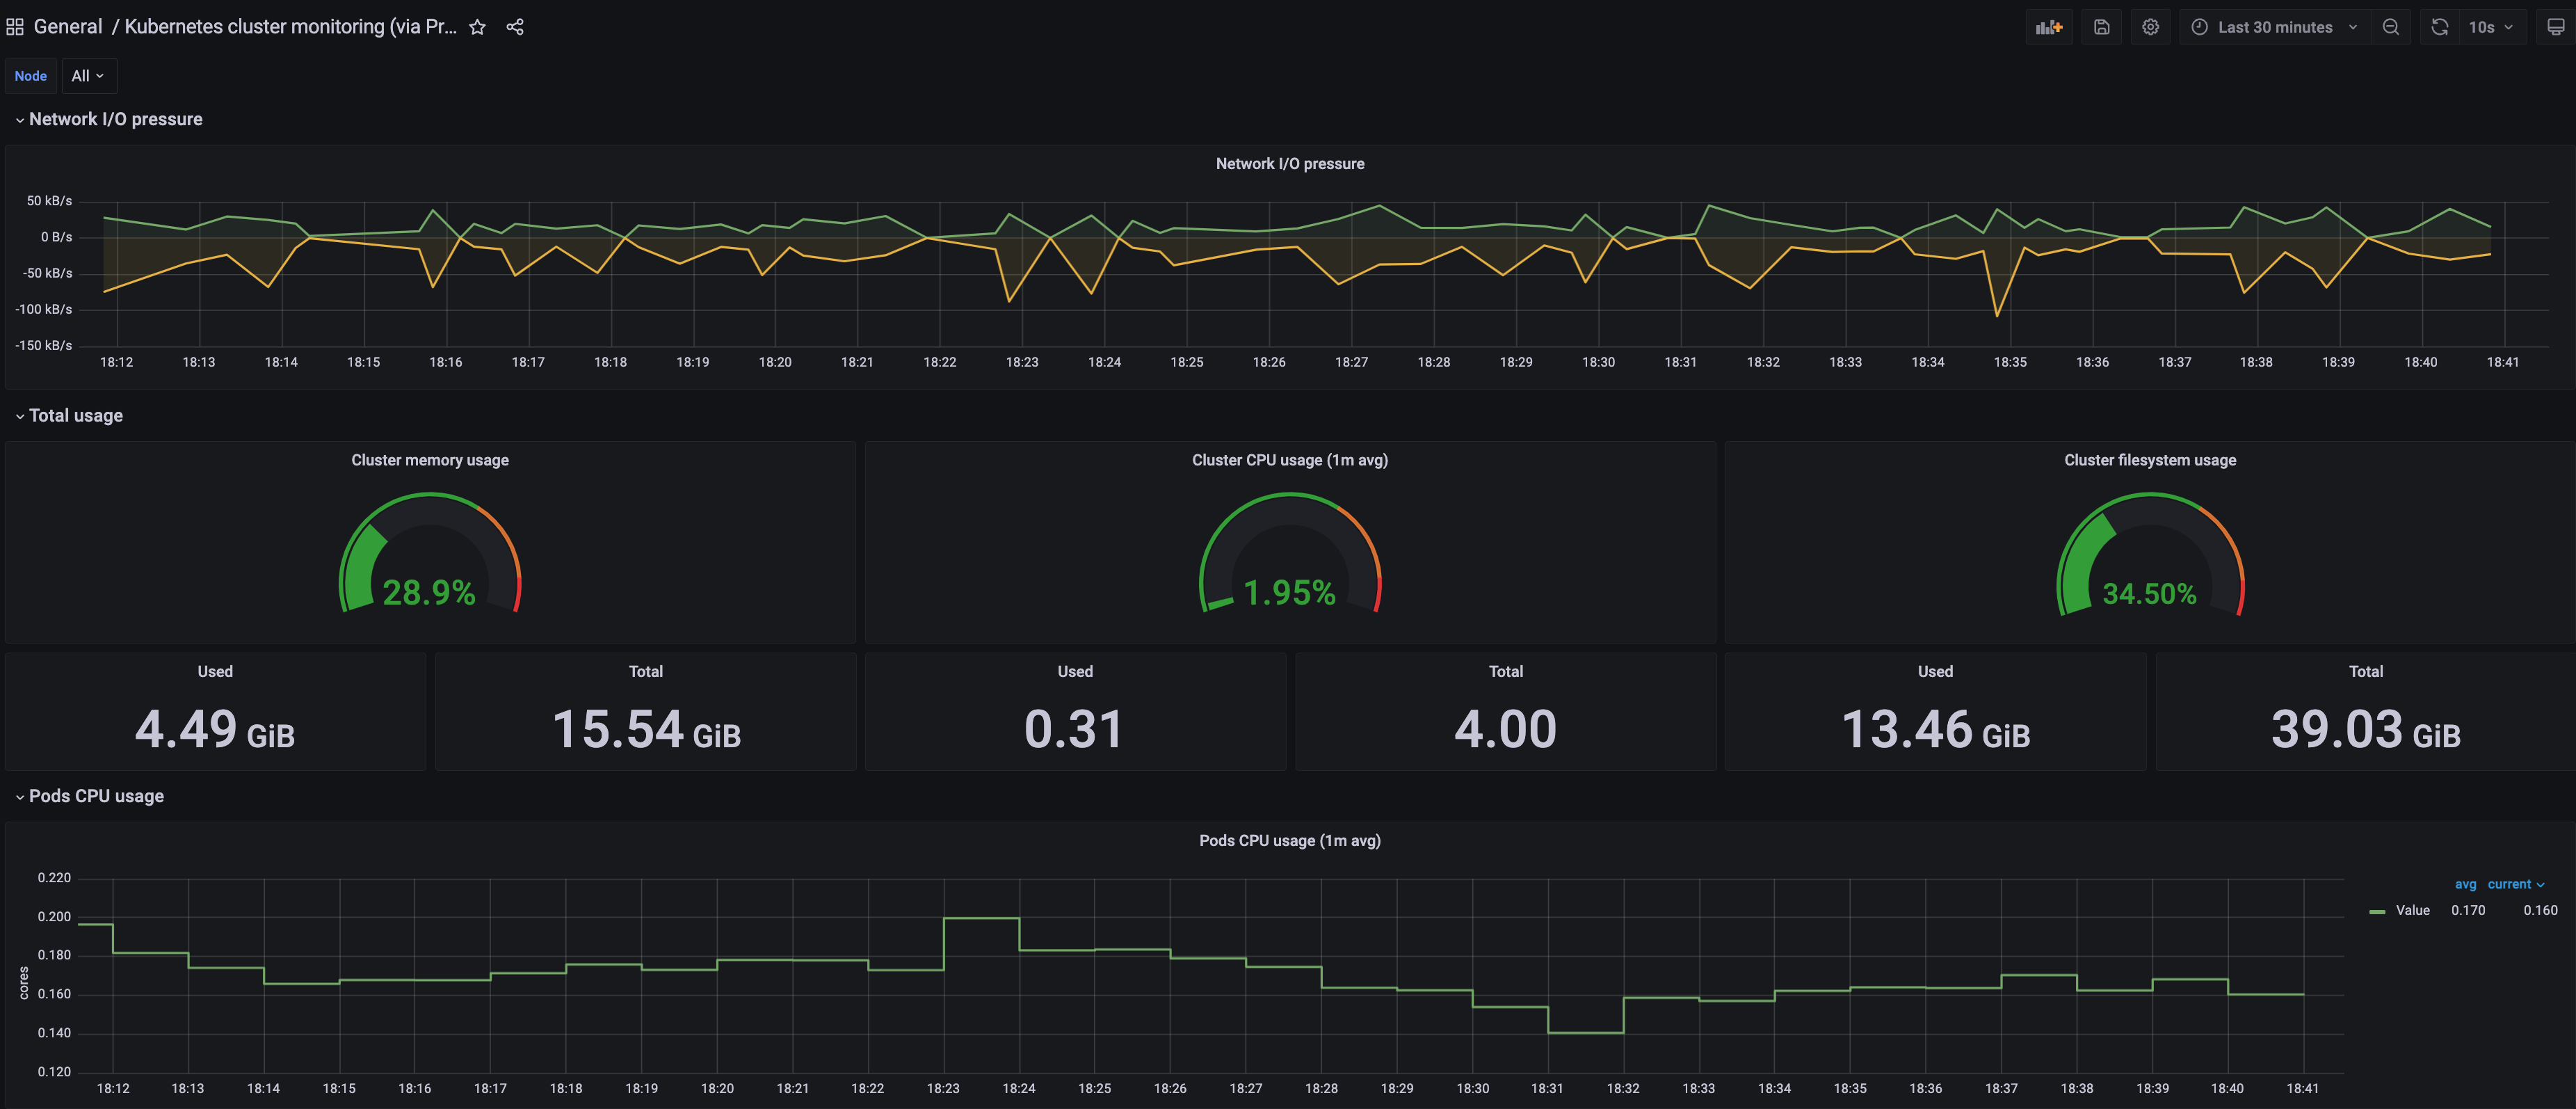
-
Perform the same procedure for template
1860. ANode Exporter Fulldashboard will be displayed.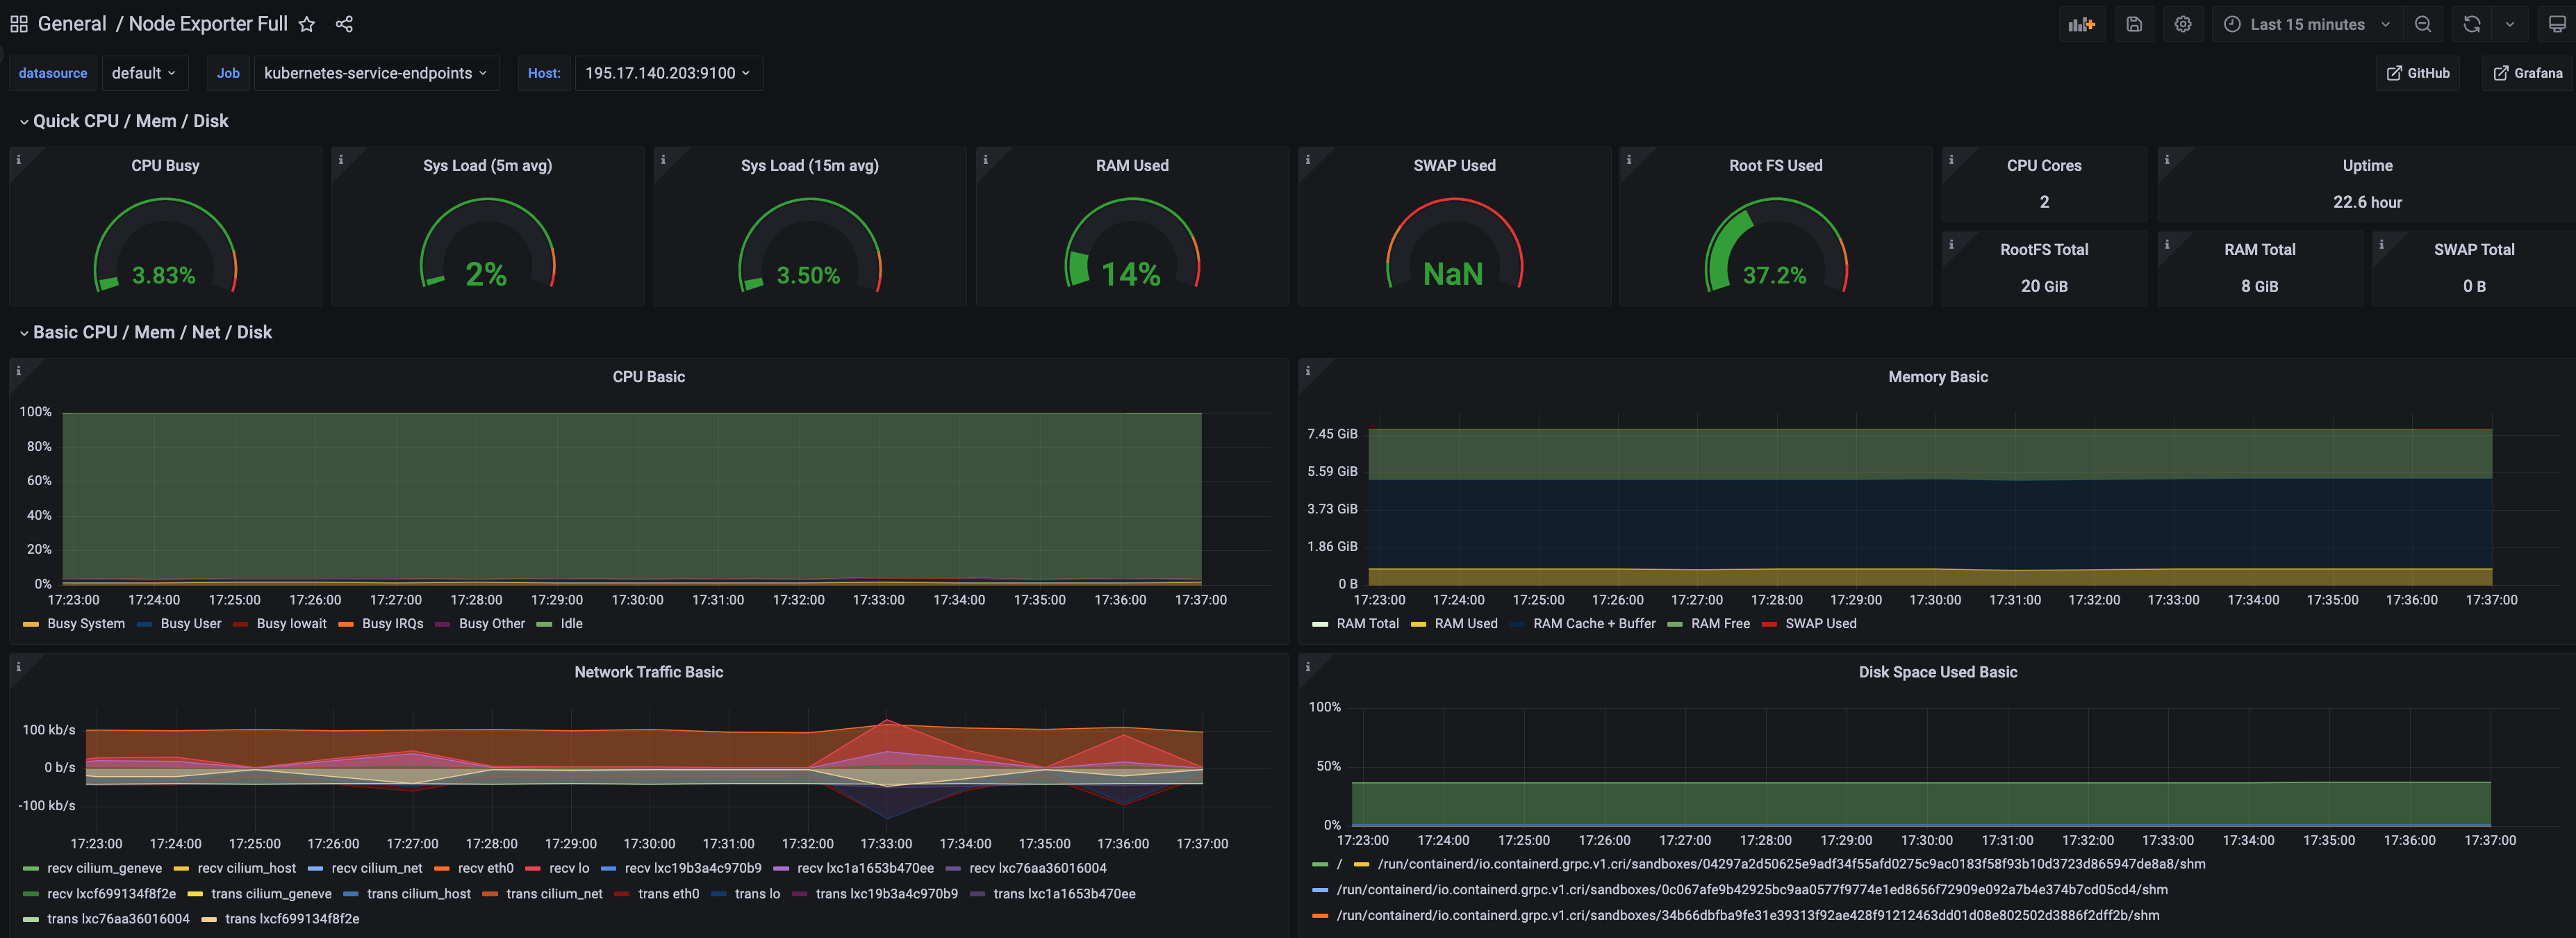
2 - ADOT use cases
Important
To install ADOT package, please follow the installation guide.2.1 - ADOT with AMP and AMG
This tutorial demonstrates how to config the ADOT package to scrape metrics from an EKS Anywhere cluster, and send them to Amazon Managed Service for Prometheus (AMP) and Amazon Managed Grafana (AMG).
This tutorial walks through the following procedures:
- Create an AMP workspace ;
- Create a cluster with IAM Roles for Service Account (IRSA) ;
- Install the ADOT package ;
- Create an AMG workspace and connect to the AMP workspace .
Note
- We included
Testsections below for critical steps to help users to validate they have completed such procedure properly. We recommend going through them in sequence as checkpoints of the progress. - We recommend creating all resources in the
us-west-2region.
Create an AMP workspace
An AMP workspace is created to receive metrics from the ADOT package, and respond to query requests from AMG. Follow steps below to complete the set up:
-
Open the AMP console at https://console.aws.amazon.com/prometheus/.
-
Choose region
us-west-2from the top right corner. -
Click on
Createto create a workspace. -
Type a workspace alias (
adot-amp-testas an example), and click onCreate workspace.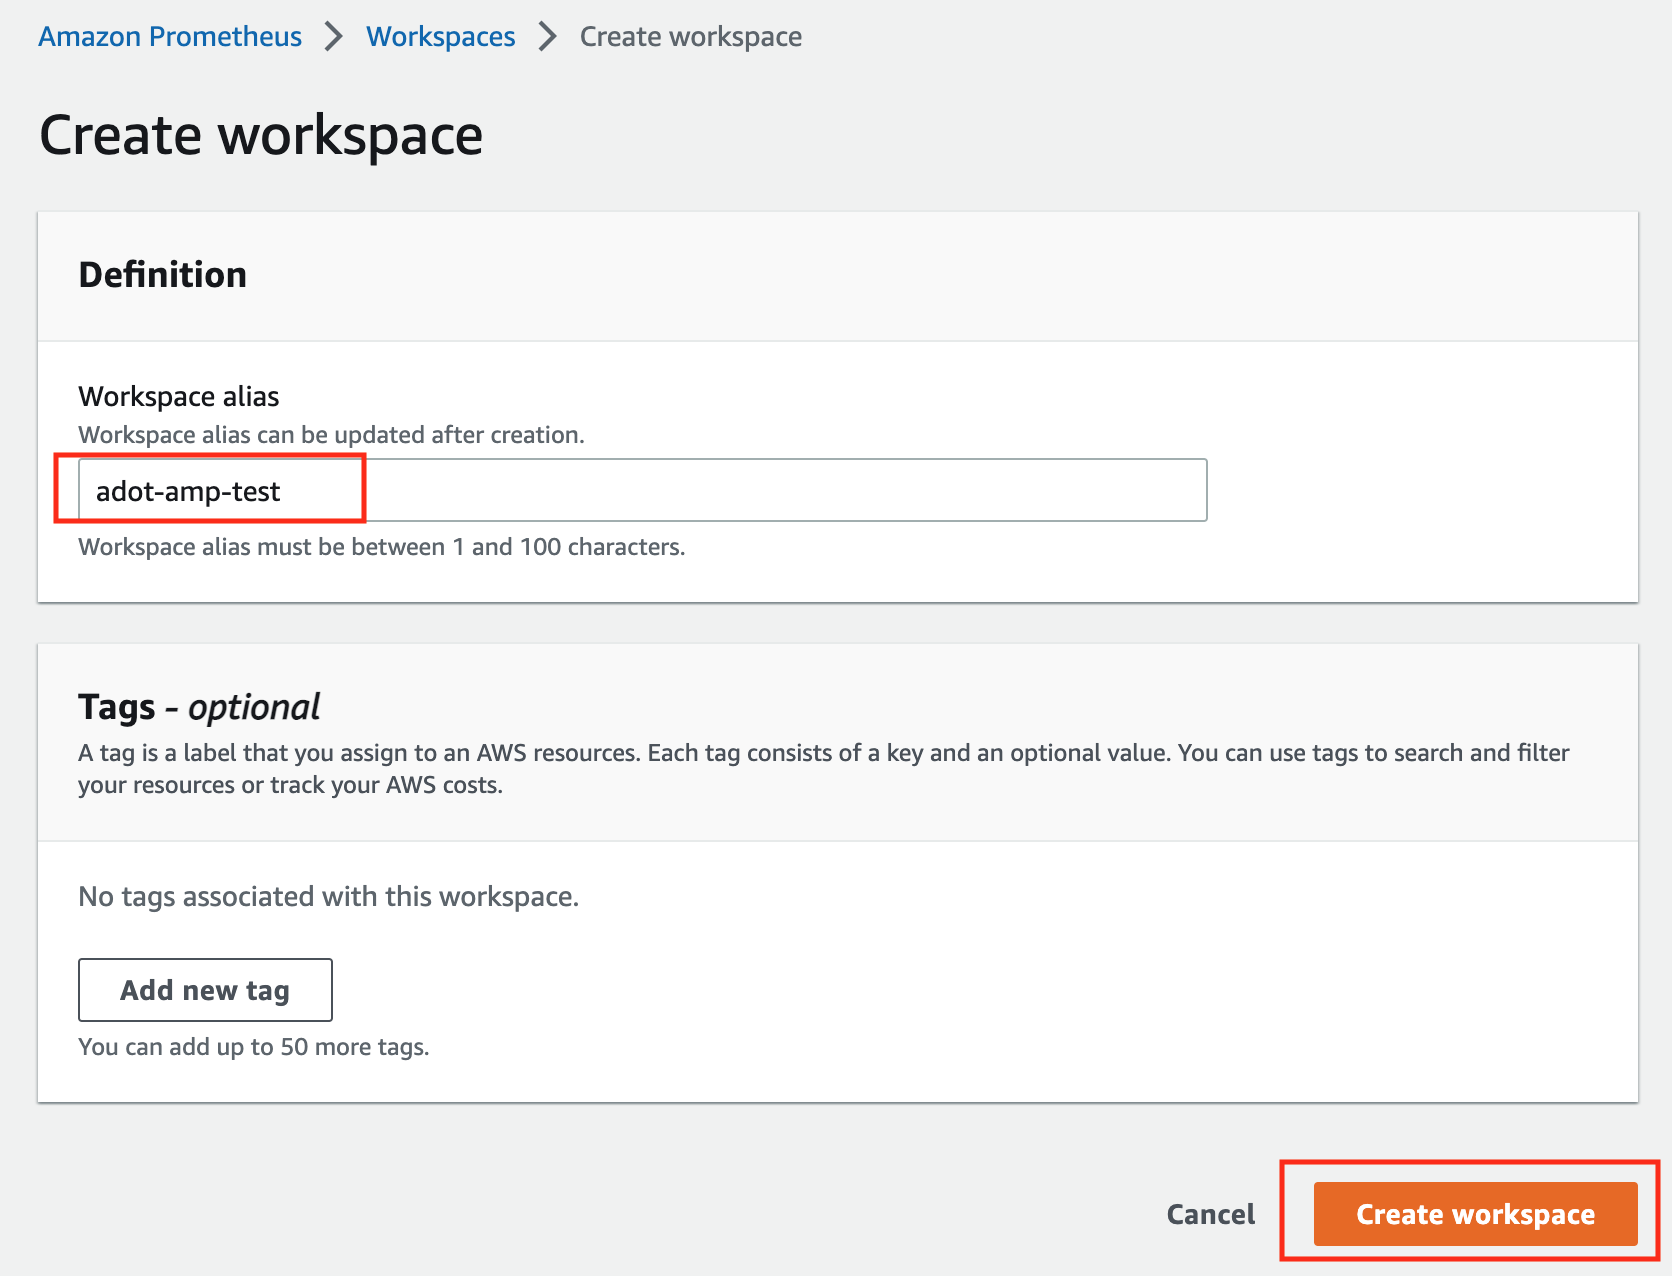
-
Make notes of the URLs displayed for
Endpoint - remote write URLandEndpoint - query URL. You’ll need them when you configure your ADOT package to remote write metrics to this workspace and when you query metrics from this workspace. Make sure the workspace’sStatusshowsActivebefore proceeding to the next step.
For additional options (i.e. through CLI) and configurations (i.e. add a tag) to create an AMP workspace, refer to AWS AMP create a workspace guide.
Create a cluster with IRSA
To enable ADOT pods that run in EKS Anywhere clusters to authenticate with AWS services, a user needs to set up IRSA at cluster creation. EKS Anywhere cluster spec for Pod IAM gives step-by-step guidance on how to do so. There are a few things to keep in mind while working through the guide:
-
While completing step Create an OIDC provider , a user should:
-
create the S3 bucket in the
us-west-2region, and -
attach an IAM policy with proper AMP access to the IAM role.
Below is an example that gives full access to AMP actions and resources. Refer to AMP IAM permissions and policies guide for more customized options.
{
    "Version": "2012-10-17",
    "Statement": [
        {
            "Action": [
                "aps:*"
            ],
            "Effect": "Allow",
            "Resource": "*"
        }
    ]
}
-
-
While completing step deploy pod identity webhook , a user should:
- make sure the service account is created in the same namespace as the ADOT package (which is controlled by the
packagedefinition file with fieldspec.targetNamespace); - take a note of the service account that gets created in this step as it will be used in ADOT package installation;
- add an annotation
eks.amazonaws.com/role-arn: <role-arn>to the created service account.
By default, the service account is installed in the
defaultnamespace with namepod-identity-webhook, and the annotationeks.amazonaws.com/role-arn: <role-arn>is not added automatically. - make sure the service account is created in the same namespace as the ADOT package (which is controlled by the
IRSA Set Up Test
To ensure IRSA is set up properly in the cluster, a user can create an awscli pod for testing.
-
Apply the following yaml file in the cluster:
kubectl apply -f - <<EOF apiVersion: v1 kind: Pod metadata: name: awscli spec: serviceAccountName: pod-identity-webhook containers: - image: amazon/aws-cli command: - sleep - "infinity" name: awscli resources: {} dnsPolicy: ClusterFirst restartPolicy: Always EOF -
Exec into the pod:
kubectl exec -it awscli -- /bin/bash -
Check if the pod can list AMP workspaces:
aws amp list-workspaces --region=us-west-2 -
If the pod has issues listing AMP workspaces, re-visit IRSA set up guidance before proceeding to the next step.
-
Exit the pod:
exit
Install the ADOT package
The ADOT package will be created with three components:
-
the Prometheus Receiver, which is designed to be a drop-in replacement for a Prometheus Server and is capable of scraping metrics from microservices instrumented with the Prometheus client library ;
-
the Prometheus Remote Write Exporter, which employs the remote write features and send metrics to AMP for long term storage;
-
the Sigv4 Authentication Extension, which enables ADOT pods to authenticate to AWS services.
Follow steps below to complete the ADOT package installation:
-
Update the following config file. Review comments carefully and replace everything that is wrapped with a
<>tag. Note this configuration aims to mimic the Prometheus community helm chart. A user can tailor the scrape targets further by modifying the receiver section below. Refer to ADOT package spec for additional explanations of each section.Click to expand ADOT package config
apiVersion: packages.eks.amazonaws.com/v1alpha1 kind: Package metadata: name: my-adot namespace: eksa-packages spec: packageName: adot targetNamespace: default # this needs to match the namespace of the serviceAccount below config: | mode: deployment serviceAccount: # Specifies whether a service account should be created create: false # Annotations to add to the service account annotations: {} # Specifies the serviceAccount annotated with eks.amazonaws.com/role-arn. name: "pod-identity-webhook" # name of the service account created at step Create a cluster with IRSA config: extensions: sigv4auth: region: "us-west-2" service: "aps" assume_role: sts_region: "us-west-2" receivers: # Scrape configuration for the Prometheus Receiver prometheus: config: global: scrape_interval: 15s scrape_timeout: 10s scrape_configs: - job_name: kubernetes-apiservers bearer_token_file: /var/run/secrets/kubernetes.io/serviceaccount/token kubernetes_sd_configs: - role: endpoints relabel_configs: - action: keep regex: default;kubernetes;https source_labels: - __meta_kubernetes_namespace - __meta_kubernetes_service_name - __meta_kubernetes_endpoint_port_name scheme: https tls_config: ca_file: /var/run/secrets/kubernetes.io/serviceaccount/ca.crt insecure_skip_verify: false - job_name: kubernetes-nodes bearer_token_file: /var/run/secrets/kubernetes.io/serviceaccount/token kubernetes_sd_configs: - role: node relabel_configs: - action: labelmap regex: __meta_kubernetes_node_label_(.+) - replacement: kubernetes.default.svc:443 target_label: __address__ - regex: (.+) replacement: /api/v1/nodes/$$1/proxy/metrics source_labels: - __meta_kubernetes_node_name target_label: __metrics_path__ scheme: https tls_config: ca_file: /var/run/secrets/kubernetes.io/serviceaccount/ca.crt insecure_skip_verify: false - job_name: kubernetes-nodes-cadvisor bearer_token_file: /var/run/secrets/kubernetes.io/serviceaccount/token kubernetes_sd_configs: - role: node relabel_configs: - action: labelmap regex: __meta_kubernetes_node_label_(.+) - replacement: kubernetes.default.svc:443 target_label: __address__ - regex: (.+) replacement: /api/v1/nodes/$$1/proxy/metrics/cadvisor source_labels: - __meta_kubernetes_node_name target_label: __metrics_path__ scheme: https tls_config: ca_file: /var/run/secrets/kubernetes.io/serviceaccount/ca.crt insecure_skip_verify: false - job_name: kubernetes-service-endpoints kubernetes_sd_configs: - role: endpoints relabel_configs: - action: keep regex: true source_labels: - __meta_kubernetes_service_annotation_prometheus_io_scrape - action: replace regex: (https?) source_labels: - __meta_kubernetes_service_annotation_prometheus_io_scheme target_label: __scheme__ - action: replace regex: (.+) source_labels: - __meta_kubernetes_service_annotation_prometheus_io_path target_label: __metrics_path__ - action: replace regex: ([^:]+)(?::\d+)?;(\d+) replacement: $$1:$$2 source_labels: - __address__ - __meta_kubernetes_service_annotation_prometheus_io_port target_label: __address__ - action: labelmap regex: __meta_kubernetes_service_annotation_prometheus_io_param_(.+) replacement: __param_$$1 - action: labelmap regex: __meta_kubernetes_service_label_(.+) - action: replace source_labels: - __meta_kubernetes_namespace target_label: kubernetes_namespace - action: replace source_labels: - __meta_kubernetes_service_name target_label: kubernetes_name - action: replace source_labels: - __meta_kubernetes_pod_node_name target_label: kubernetes_node - job_name: kubernetes-service-endpoints-slow kubernetes_sd_configs: - role: endpoints relabel_configs: - action: keep regex: true source_labels: - __meta_kubernetes_service_annotation_prometheus_io_scrape_slow - action: replace regex: (https?) source_labels: - __meta_kubernetes_service_annotation_prometheus_io_scheme target_label: __scheme__ - action: replace regex: (.+) source_labels: - __meta_kubernetes_service_annotation_prometheus_io_path target_label: __metrics_path__ - action: replace regex: ([^:]+)(?::\d+)?;(\d+) replacement: $$1:$$2 source_labels: - __address__ - __meta_kubernetes_service_annotation_prometheus_io_port target_label: __address__ - action: labelmap regex: __meta_kubernetes_service_annotation_prometheus_io_param_(.+) replacement: __param_$$1 - action: labelmap regex: __meta_kubernetes_service_label_(.+) - action: replace source_labels: - __meta_kubernetes_namespace target_label: kubernetes_namespace - action: replace source_labels: - __meta_kubernetes_service_name target_label: kubernetes_name - action: replace source_labels: - __meta_kubernetes_pod_node_name target_label: kubernetes_node scrape_interval: 5m scrape_timeout: 30s - job_name: prometheus-pushgateway kubernetes_sd_configs: - role: service relabel_configs: - action: keep regex: pushgateway source_labels: - __meta_kubernetes_service_annotation_prometheus_io_probe - job_name: kubernetes-services kubernetes_sd_configs: - role: service metrics_path: /probe params: module: - http_2xx relabel_configs: - action: keep regex: true source_labels: - __meta_kubernetes_service_annotation_prometheus_io_probe - source_labels: - __address__ target_label: __param_target - replacement: blackbox target_label: __address__ - source_labels: - __param_target target_label: instance - action: labelmap regex: __meta_kubernetes_service_label_(.+) - source_labels: - __meta_kubernetes_namespace target_label: kubernetes_namespace - source_labels: - __meta_kubernetes_service_name target_label: kubernetes_name - job_name: kubernetes-pods kubernetes_sd_configs: - role: pod relabel_configs: - action: keep regex: true source_labels: - __meta_kubernetes_pod_annotation_prometheus_io_scrape - action: replace regex: (https?) source_labels: - __meta_kubernetes_pod_annotation_prometheus_io_scheme target_label: __scheme__ - action: replace regex: (.+) source_labels: - __meta_kubernetes_pod_annotation_prometheus_io_path target_label: __metrics_path__ - action: replace regex: ([^:]+)(?::\d+)?;(\d+) replacement: $$1:$$2 source_labels: - __address__ - __meta_kubernetes_pod_annotation_prometheus_io_port target_label: __address__ - action: labelmap regex: __meta_kubernetes_pod_annotation_prometheus_io_param_(.+) replacement: __param_$$1 - action: labelmap regex: __meta_kubernetes_pod_label_(.+) - action: replace source_labels: - __meta_kubernetes_namespace target_label: kubernetes_namespace - action: replace source_labels: - __meta_kubernetes_pod_name target_label: kubernetes_pod_name - action: drop regex: Pending|Succeeded|Failed|Completed source_labels: - __meta_kubernetes_pod_phase - job_name: kubernetes-pods-slow scrape_interval: 5m scrape_timeout: 30s kubernetes_sd_configs: - role: pod relabel_configs: - action: keep regex: true source_labels: - __meta_kubernetes_pod_annotation_prometheus_io_scrape_slow - action: replace regex: (https?) source_labels: - __meta_kubernetes_pod_annotation_prometheus_io_scheme target_label: __scheme__ - action: replace regex: (.+) source_labels: - __meta_kubernetes_pod_annotation_prometheus_io_path target_label: __metrics_path__ - action: replace regex: ([^:]+)(?::\d+)?;(\d+) replacement: $$1:$$2 source_labels: - __address__ - __meta_kubernetes_pod_annotation_prometheus_io_port target_label: __address__ - action: labelmap regex: __meta_kubernetes_pod_annotation_prometheus_io_param_(.+) replacement: __param_$1 - action: labelmap regex: __meta_kubernetes_pod_label_(.+) - action: replace source_labels: - __meta_kubernetes_namespace target_label: namespace - action: replace source_labels: - __meta_kubernetes_pod_name target_label: pod - action: drop regex: Pending|Succeeded|Failed|Completed source_labels: - __meta_kubernetes_pod_phase processors: batch/metrics: timeout: 60s exporters: logging: logLevel: info prometheusremotewrite: endpoint: "<AMP-WORKSPACE>/api/v1/remote_write" # Replace with your AMP workspace auth: authenticator: sigv4auth service: extensions: - health_check - memory_ballast - sigv4auth pipelines: metrics: receivers: [prometheus] processors: [batch/metrics] exporters: [logging, prometheusremotewrite] -
Bind additional roles to the service account
pod-identity-webhook(created at step Create a cluster with IRSA ) by applying the following file in the cluster (usingkubectl apply -f <file-name>). This is becausepod-identity-webhookby design does not have sufficient permissions to scrape all Kubernetes targets listed in the ADOT config file above. If modifications are made to the Prometheus Receiver, make updates to the file below to add / remove additional permissions before applying the file.Click to expand clusterrole and clusterrolebinding config
--- apiVersion: rbac.authorization.k8s.io/v1 kind: ClusterRole metadata: name: otel-prometheus-role rules: - apiGroups: - "" resources: - nodes - nodes/proxy - services - endpoints - pods verbs: - get - list - watch - apiGroups: - extensions resources: - ingresses verbs: - get - list - watch - nonResourceURLs: - /metrics verbs: - get --- apiVersion: rbac.authorization.k8s.io/v1 kind: ClusterRoleBinding metadata: name: otel-prometheus-role-binding roleRef: apiGroup: rbac.authorization.k8s.io kind: ClusterRole name: otel-prometheus-role subjects: - kind: ServiceAccount name: pod-identity-webhook # replace with name of the service account created at step Create a cluster with IRSA namespace: default # replace with namespace where the service account was created at step Create a cluster with IRSA -
Use the ADOT package config file defined above to complete the ADOT installation. Refer to ADOT installation guide for details.
ADOT Package Test
To ensure the ADOT package is installed correctly in the cluster, a user can perform the following tests.
Check pod logs
Check ADOT pod logs using kubectl logs <adot-pod-name> -n <namespace>. It should display logs similar to below.
...
2022-09-30T23:22:59.184Z	info	service/telemetry.go:103	Setting up own telemetry...
2022-09-30T23:22:59.184Z	info	service/telemetry.go:138	Serving Prometheus metrics	{"address": "0.0.0.0:8888", "level": "basic"}
2022-09-30T23:22:59.185Z	info	components/components.go:30	In development component. May change in the future.	{"kind": "exporter", "data_type": "metrics", "name": "logging", "stability": "in development"}
2022-09-30T23:22:59.186Z	info	extensions/extensions.go:42	Starting extensions...
2022-09-30T23:22:59.186Z	info	extensions/extensions.go:45	Extension is starting...	{"kind": "extension", "name": "health_check"}
2022-09-30T23:22:59.186Z	info	healthcheckextension@v0.58.0/healthcheckextension.go:44	Starting health_check extension	{"kind": "extension", "name": "health_check", "config": {"Endpoint":"0.0.0.0:13133","TLSSetting":null,"CORS":null,"Auth":null,"MaxRequestBodySize":0,"IncludeMetadata":false,"Path":"/","CheckCollectorPipeline":{"Enabled":false,"Interval":"5m","ExporterFailureThreshold":5}}}
2022-09-30T23:22:59.186Z	info	extensions/extensions.go:49	Extension started.	{"kind": "extension", "name": "health_check"}
2022-09-30T23:22:59.186Z	info	extensions/extensions.go:45	Extension is starting...	{"kind": "extension", "name": "memory_ballast"}
2022-09-30T23:22:59.187Z	info	ballastextension/memory_ballast.go:52	Setting memory ballast	{"kind": "extension", "name": "memory_ballast", "MiBs": 0}
2022-09-30T23:22:59.187Z	info	extensions/extensions.go:49	Extension started.	{"kind": "extension", "name": "memory_ballast"}
2022-09-30T23:22:59.187Z	info	extensions/extensions.go:45	Extension is starting...	{"kind": "extension", "name": "sigv4auth"}
2022-09-30T23:22:59.187Z	info	extensions/extensions.go:49	Extension started.	{"kind": "extension", "name": "sigv4auth"}
2022-09-30T23:22:59.187Z	info	pipelines/pipelines.go:74	Starting exporters...
2022-09-30T23:22:59.187Z	info	pipelines/pipelines.go:78	Exporter is starting...	{"kind": "exporter", "data_type": "metrics", "name": "logging"}
2022-09-30T23:22:59.187Z	info	pipelines/pipelines.go:82	Exporter started.	{"kind": "exporter", "data_type": "metrics", "name": "logging"}
2022-09-30T23:22:59.187Z	info	pipelines/pipelines.go:78	Exporter is starting...	{"kind": "exporter", "data_type": "metrics", "name": "prometheusremotewrite"}
2022-09-30T23:22:59.187Z	info	pipelines/pipelines.go:82	Exporter started.	{"kind": "exporter", "data_type": "metrics", "name": "prometheusremotewrite"}
2022-09-30T23:22:59.187Z	info	pipelines/pipelines.go:86	Starting processors...
2022-09-30T23:22:59.187Z	info	pipelines/pipelines.go:90	Processor is starting...	{"kind": "processor", "name": "batch/metrics", "pipeline": "metrics"}
2022-09-30T23:22:59.187Z	info	pipelines/pipelines.go:94	Processor started.	{"kind": "processor", "name": "batch/metrics", "pipeline": "metrics"}
2022-09-30T23:22:59.187Z	info	pipelines/pipelines.go:98	Starting receivers...
2022-09-30T23:22:59.187Z	info	pipelines/pipelines.go:102	Receiver is starting...	{"kind": "receiver", "name": "prometheus", "pipeline": "metrics"}
2022-09-30T23:22:59.187Z	info	kubernetes/kubernetes.go:326	Using pod service account via in-cluster config	{"kind": "receiver", "name": "prometheus", "pipeline": "metrics", "discovery": "kubernetes"}
2022-09-30T23:22:59.188Z	info	kubernetes/kubernetes.go:326	Using pod service account via in-cluster config	{"kind": "receiver", "name": "prometheus", "pipeline": "metrics", "discovery": "kubernetes"}
2022-09-30T23:22:59.188Z	info	kubernetes/kubernetes.go:326	Using pod service account via in-cluster config	{"kind": "receiver", "name": "prometheus", "pipeline": "metrics", "discovery": "kubernetes"}
2022-09-30T23:22:59.188Z	info	kubernetes/kubernetes.go:326	Using pod service account via in-cluster config	{"kind": "receiver", "name": "prometheus", "pipeline": "metrics", "discovery": "kubernetes"}
2022-09-30T23:22:59.189Z	info	pipelines/pipelines.go:106	Receiver started.	{"kind": "receiver", "name": "prometheus", "pipeline": "metrics"}
2022-09-30T23:22:59.189Z	info	healthcheck/handler.go:129	Health Check state change	{"kind": "extension", "name": "health_check", "status": "ready"}
2022-09-30T23:22:59.189Z	info	service/collector.go:215	Starting aws-otel-collector...	{"Version": "v0.21.1", "NumCPU": 2}
2022-09-30T23:22:59.189Z	info	service/collector.go:128	Everything is ready. Begin running and processing data.
...
Check AMP endpoint using awscurl
Use awscurl commands below to check if AMP received the metrics data sent by ADOT. The awscurl tool is a curl like tool with AWS Signature Version 4 request signing. The command below should return a status code success.
pip install awscurl
awscurl -X POST --region us-west-2 --service aps "<amp-query-endpoint>?query=up"
Create an AMG workspace and connect to the AMP workspace
An AMG workspace is created to query metrics from the AMP workspace and visualize the metrics in user-selected or user-built dashboards.
Follow steps below to create the AMG workspace:
-
Enable AWS Single-Sign-on (AWS SSO). Refer to IAM Identity Center for details.
-
Open the Amazon Managed Grafana console at https://console.aws.amazon.com/grafana/.
-
Choose
Create workspace. -
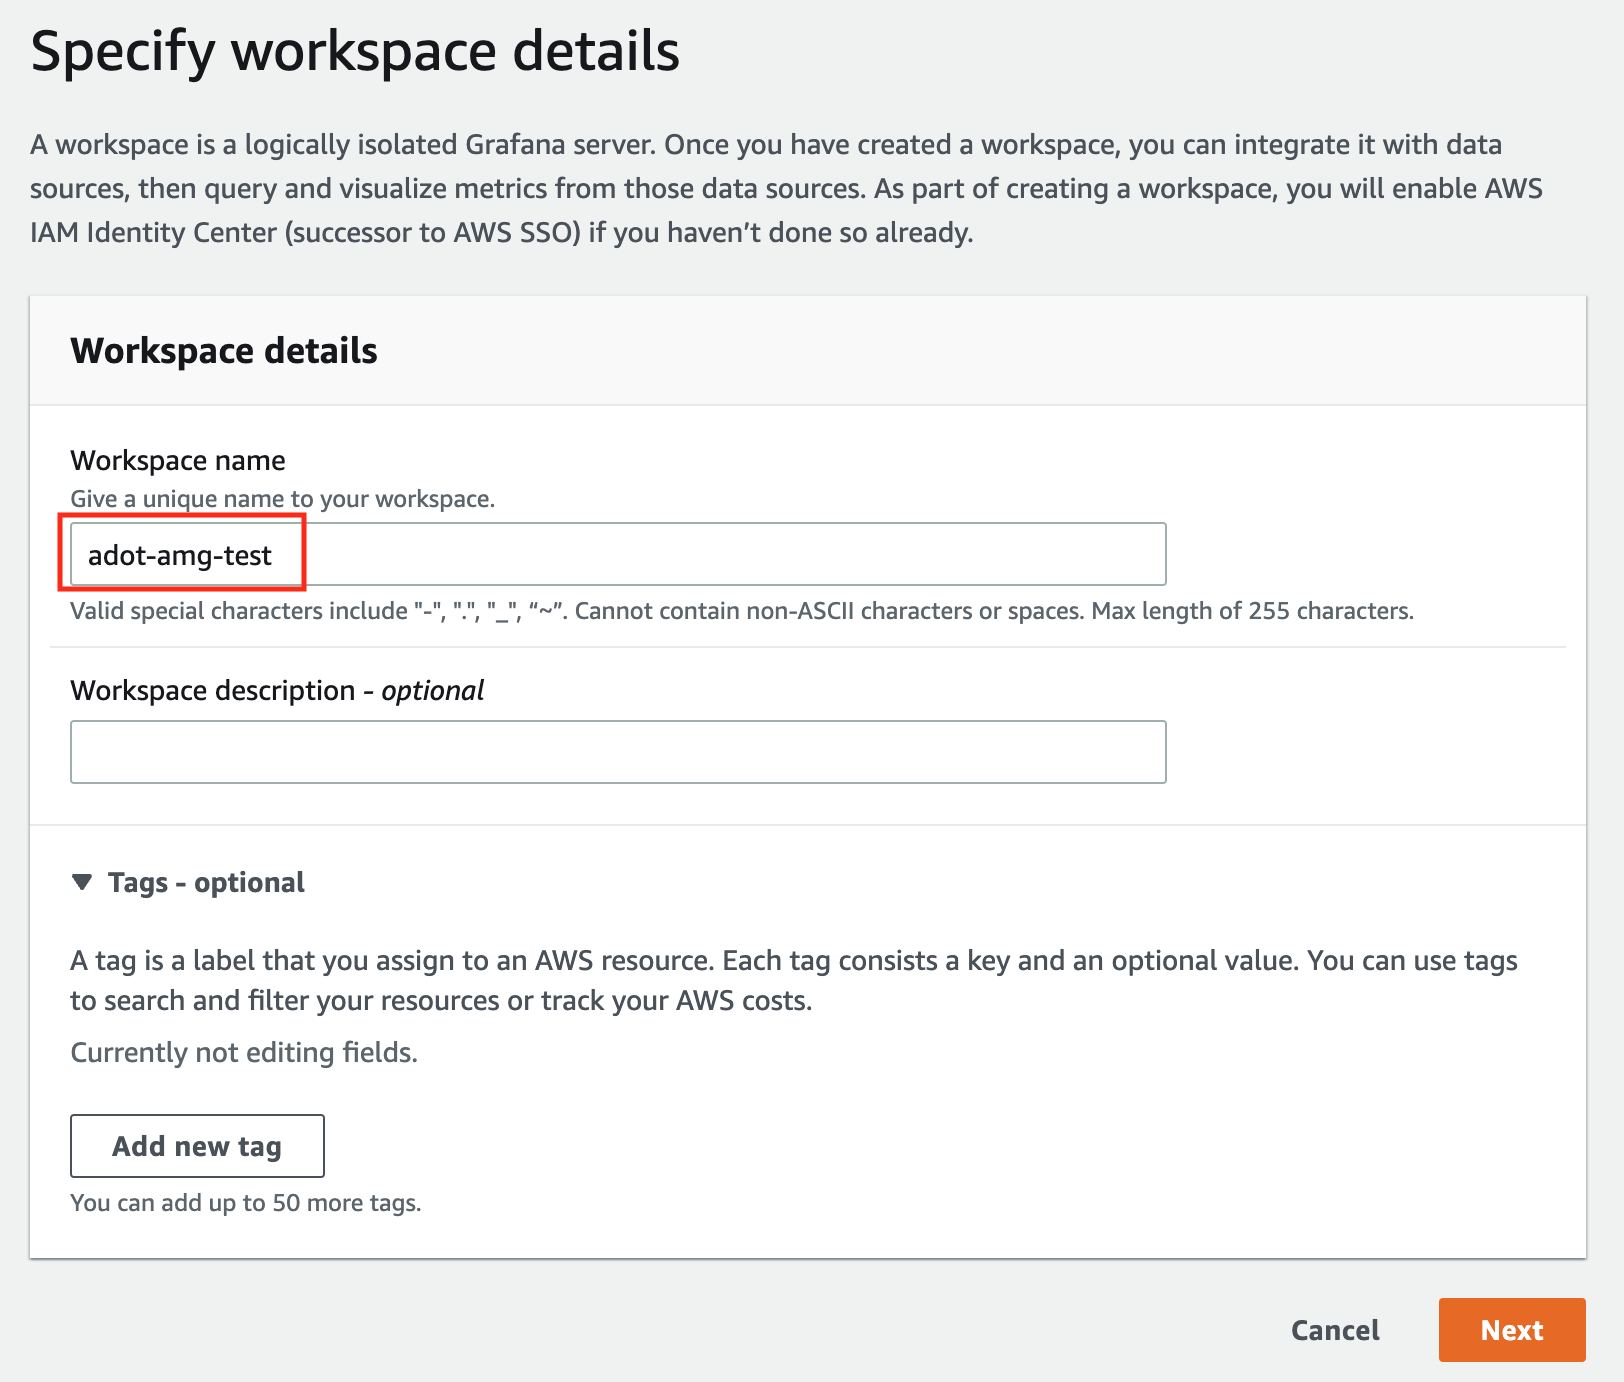
In the Workspace details window, for Workspace name, enter a name for the workspace.
-
In the config settings window, choose
Authentication accessbyAWS IAM Identity Center, andPermission typeofService managed.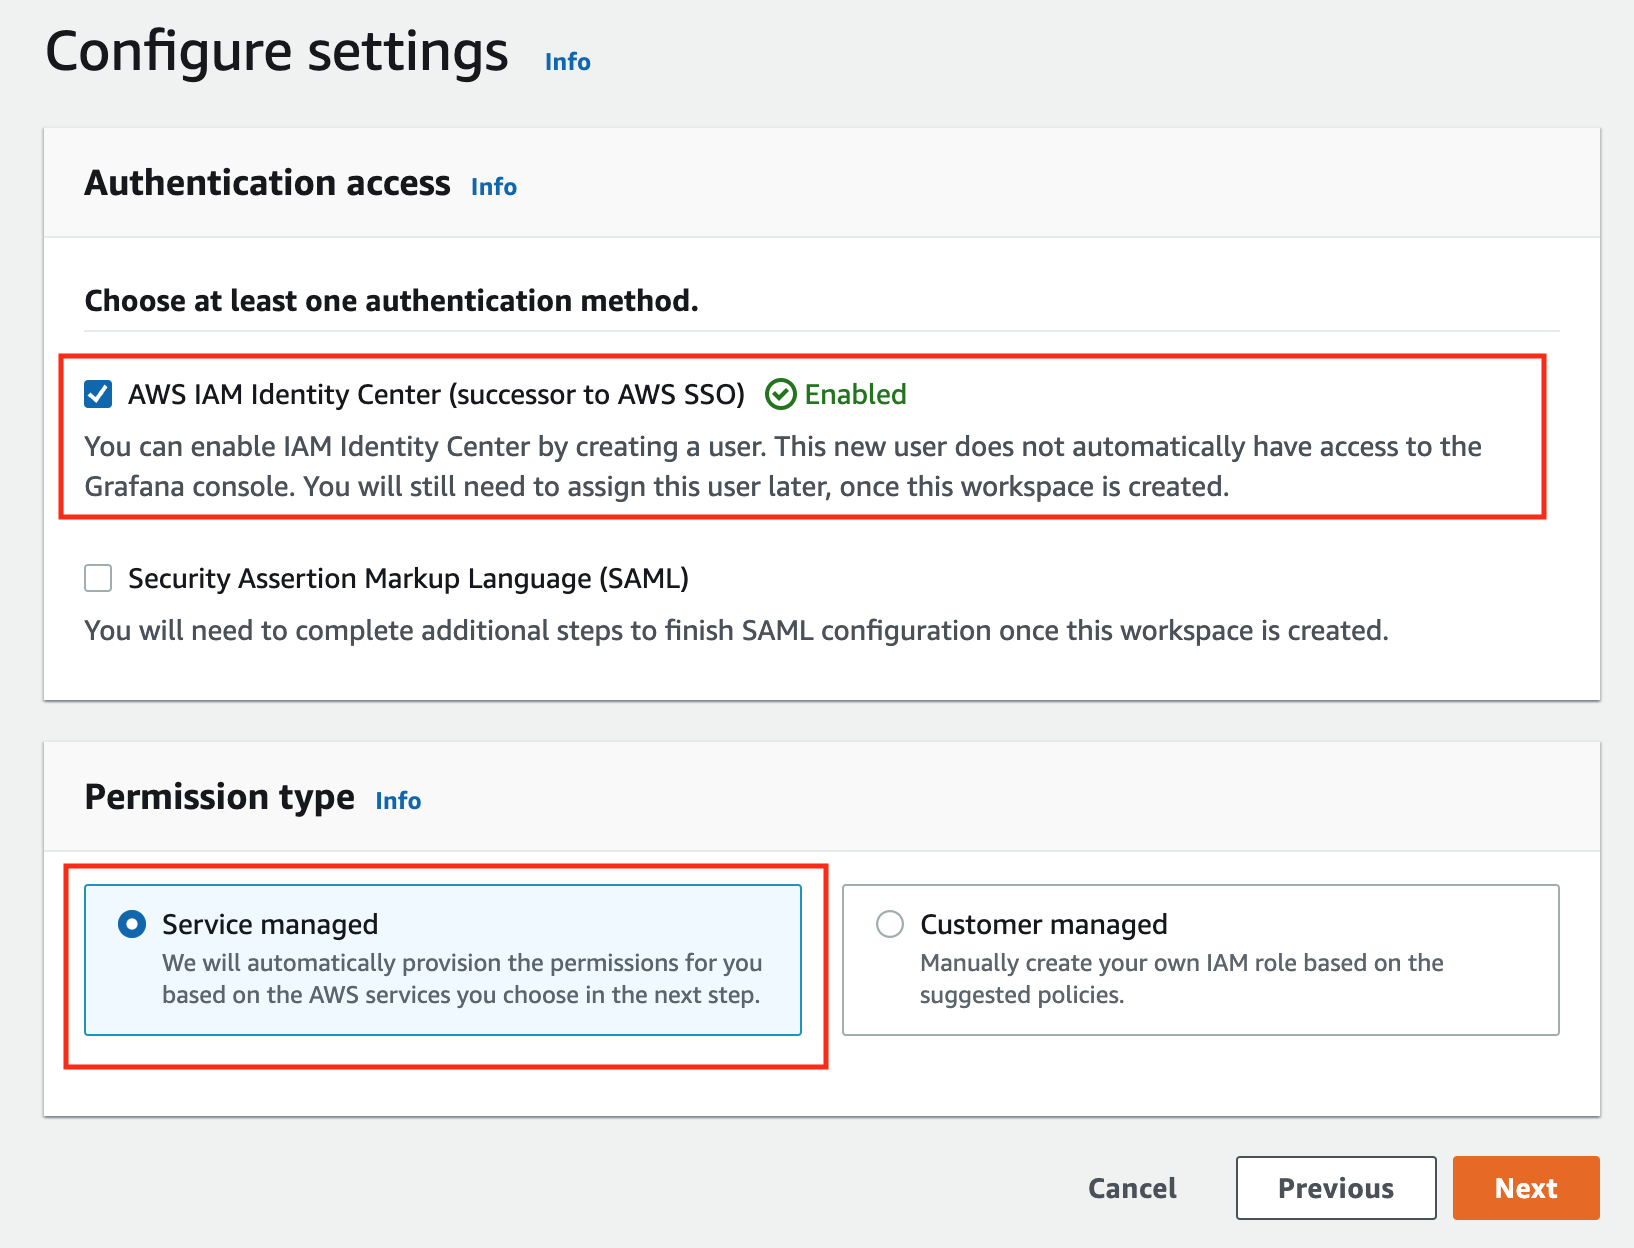
-
In the IAM permission access setting window, choose
Current accountaccess, andAmazon Managed Service for Prometheusas data source.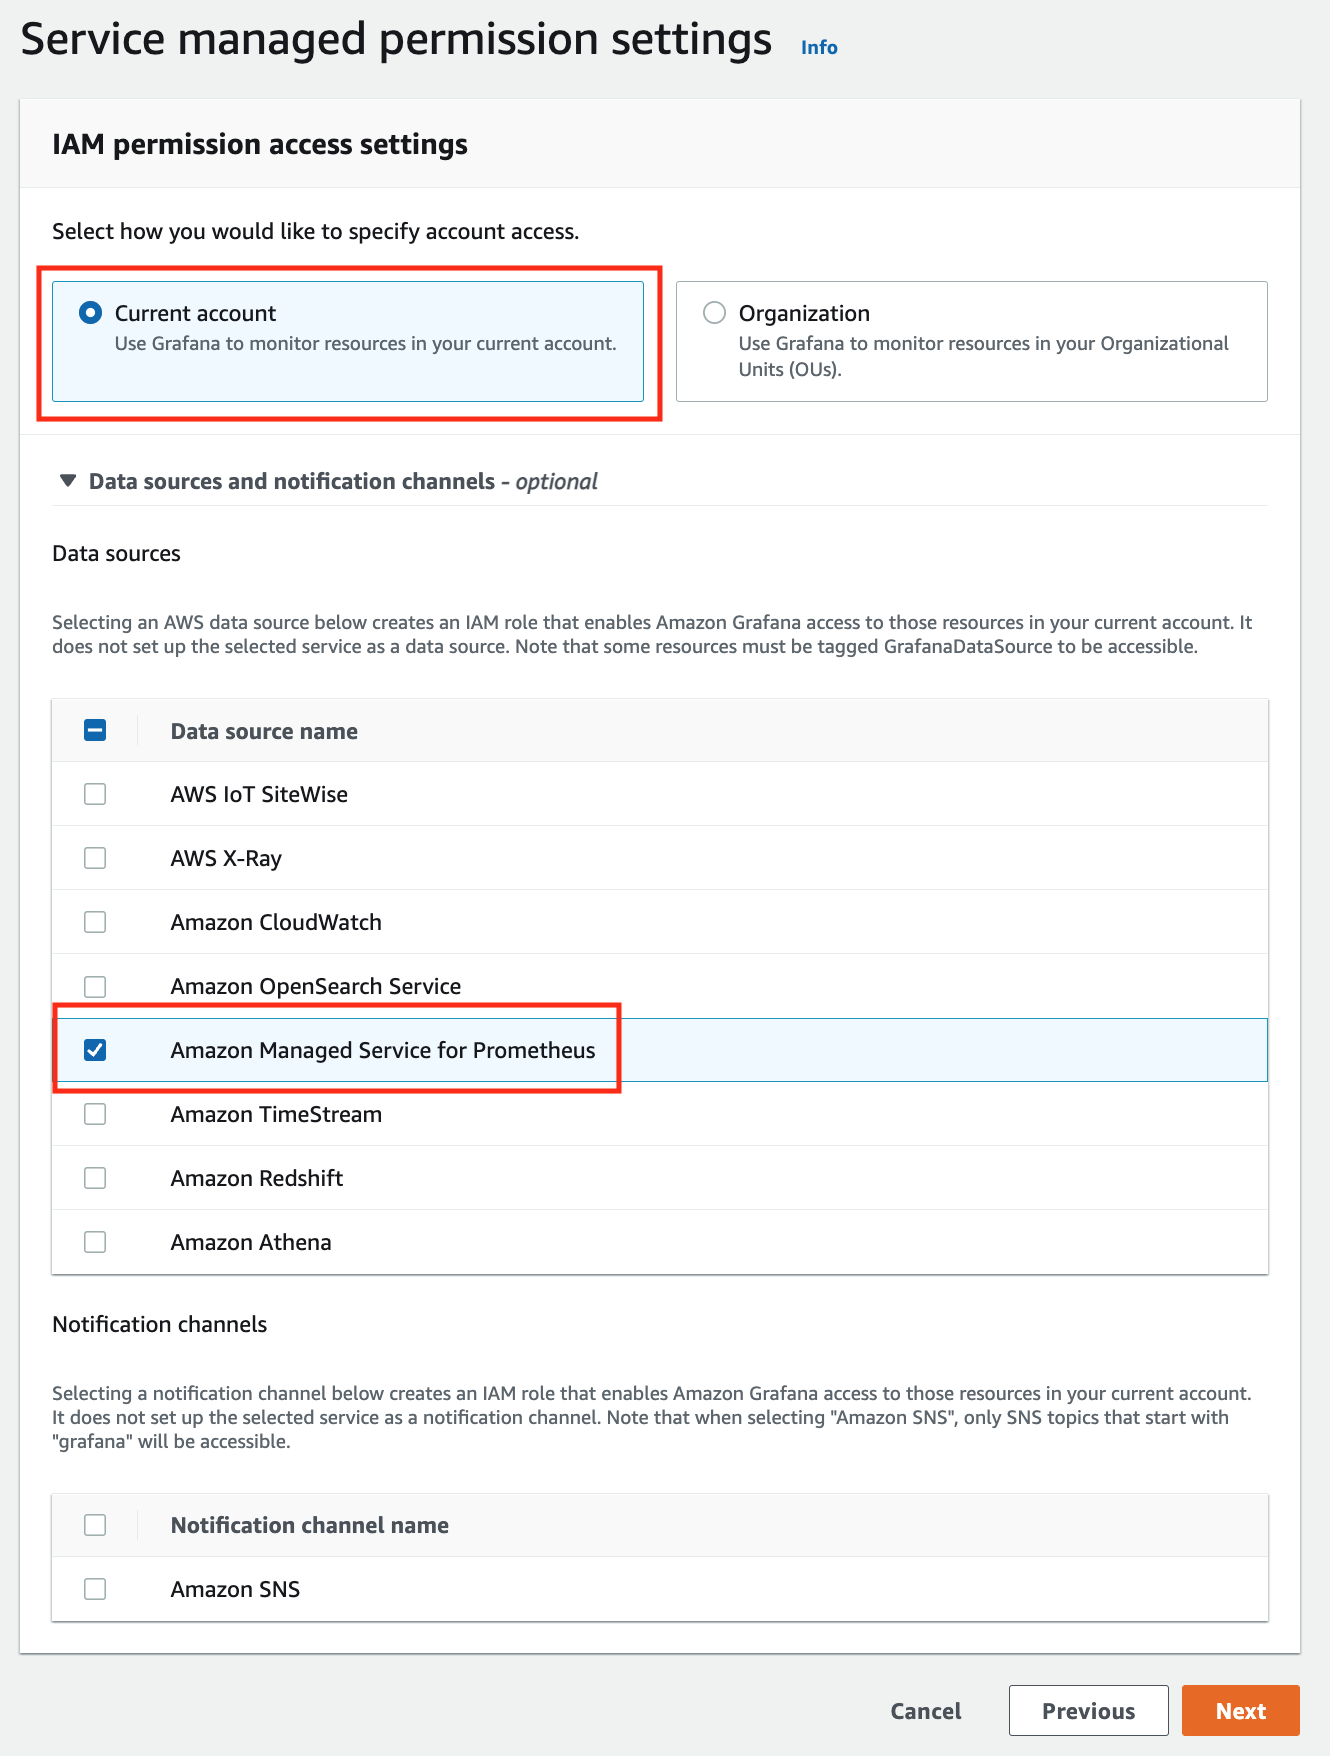
-
Review all settings and click on
Create workspace.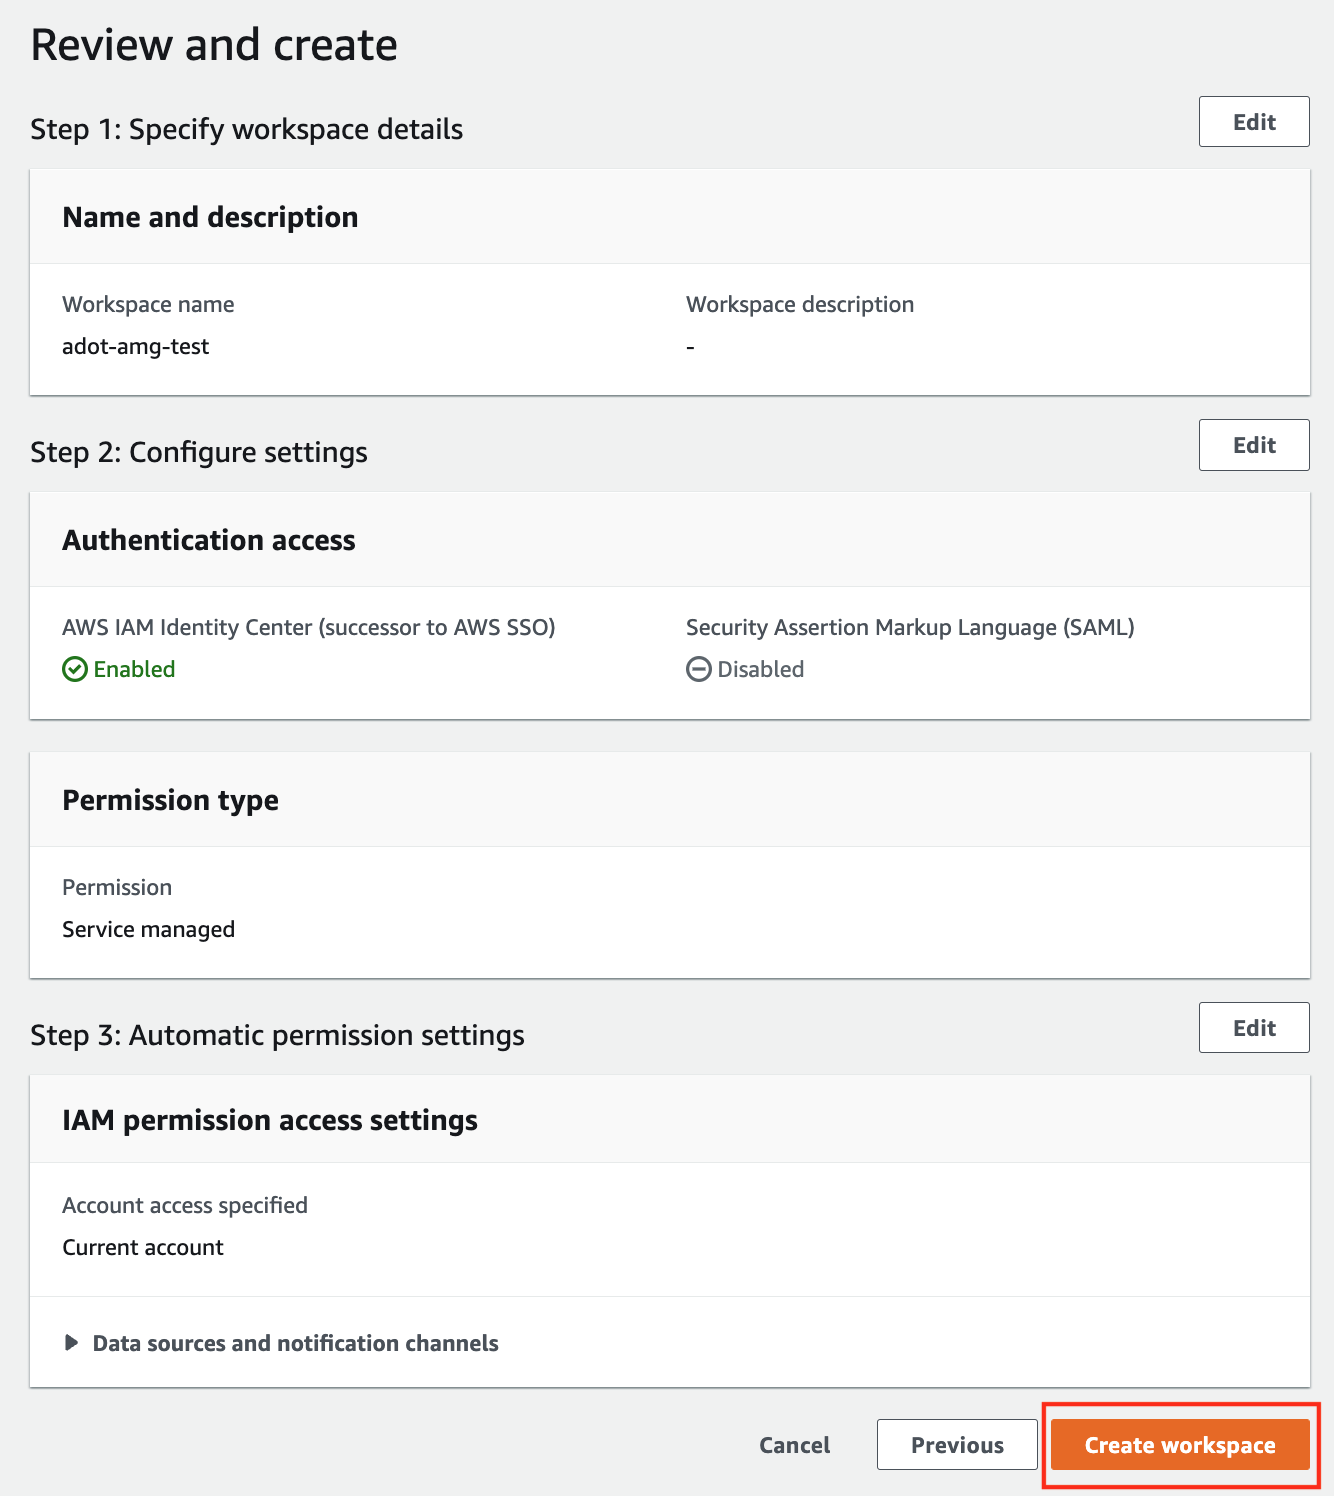
-
Once the workspace shows a
StatusofActive, you can access it by clicking theGrafana workspace URL. Click onSign in with AWS IAM Identity Centerto finish the authentication.
Follow steps below to add the AMP workspace to AMG.
-
Click on the
configsign on the left navigation bar, selectData sources, then choosePrometheusas theData source.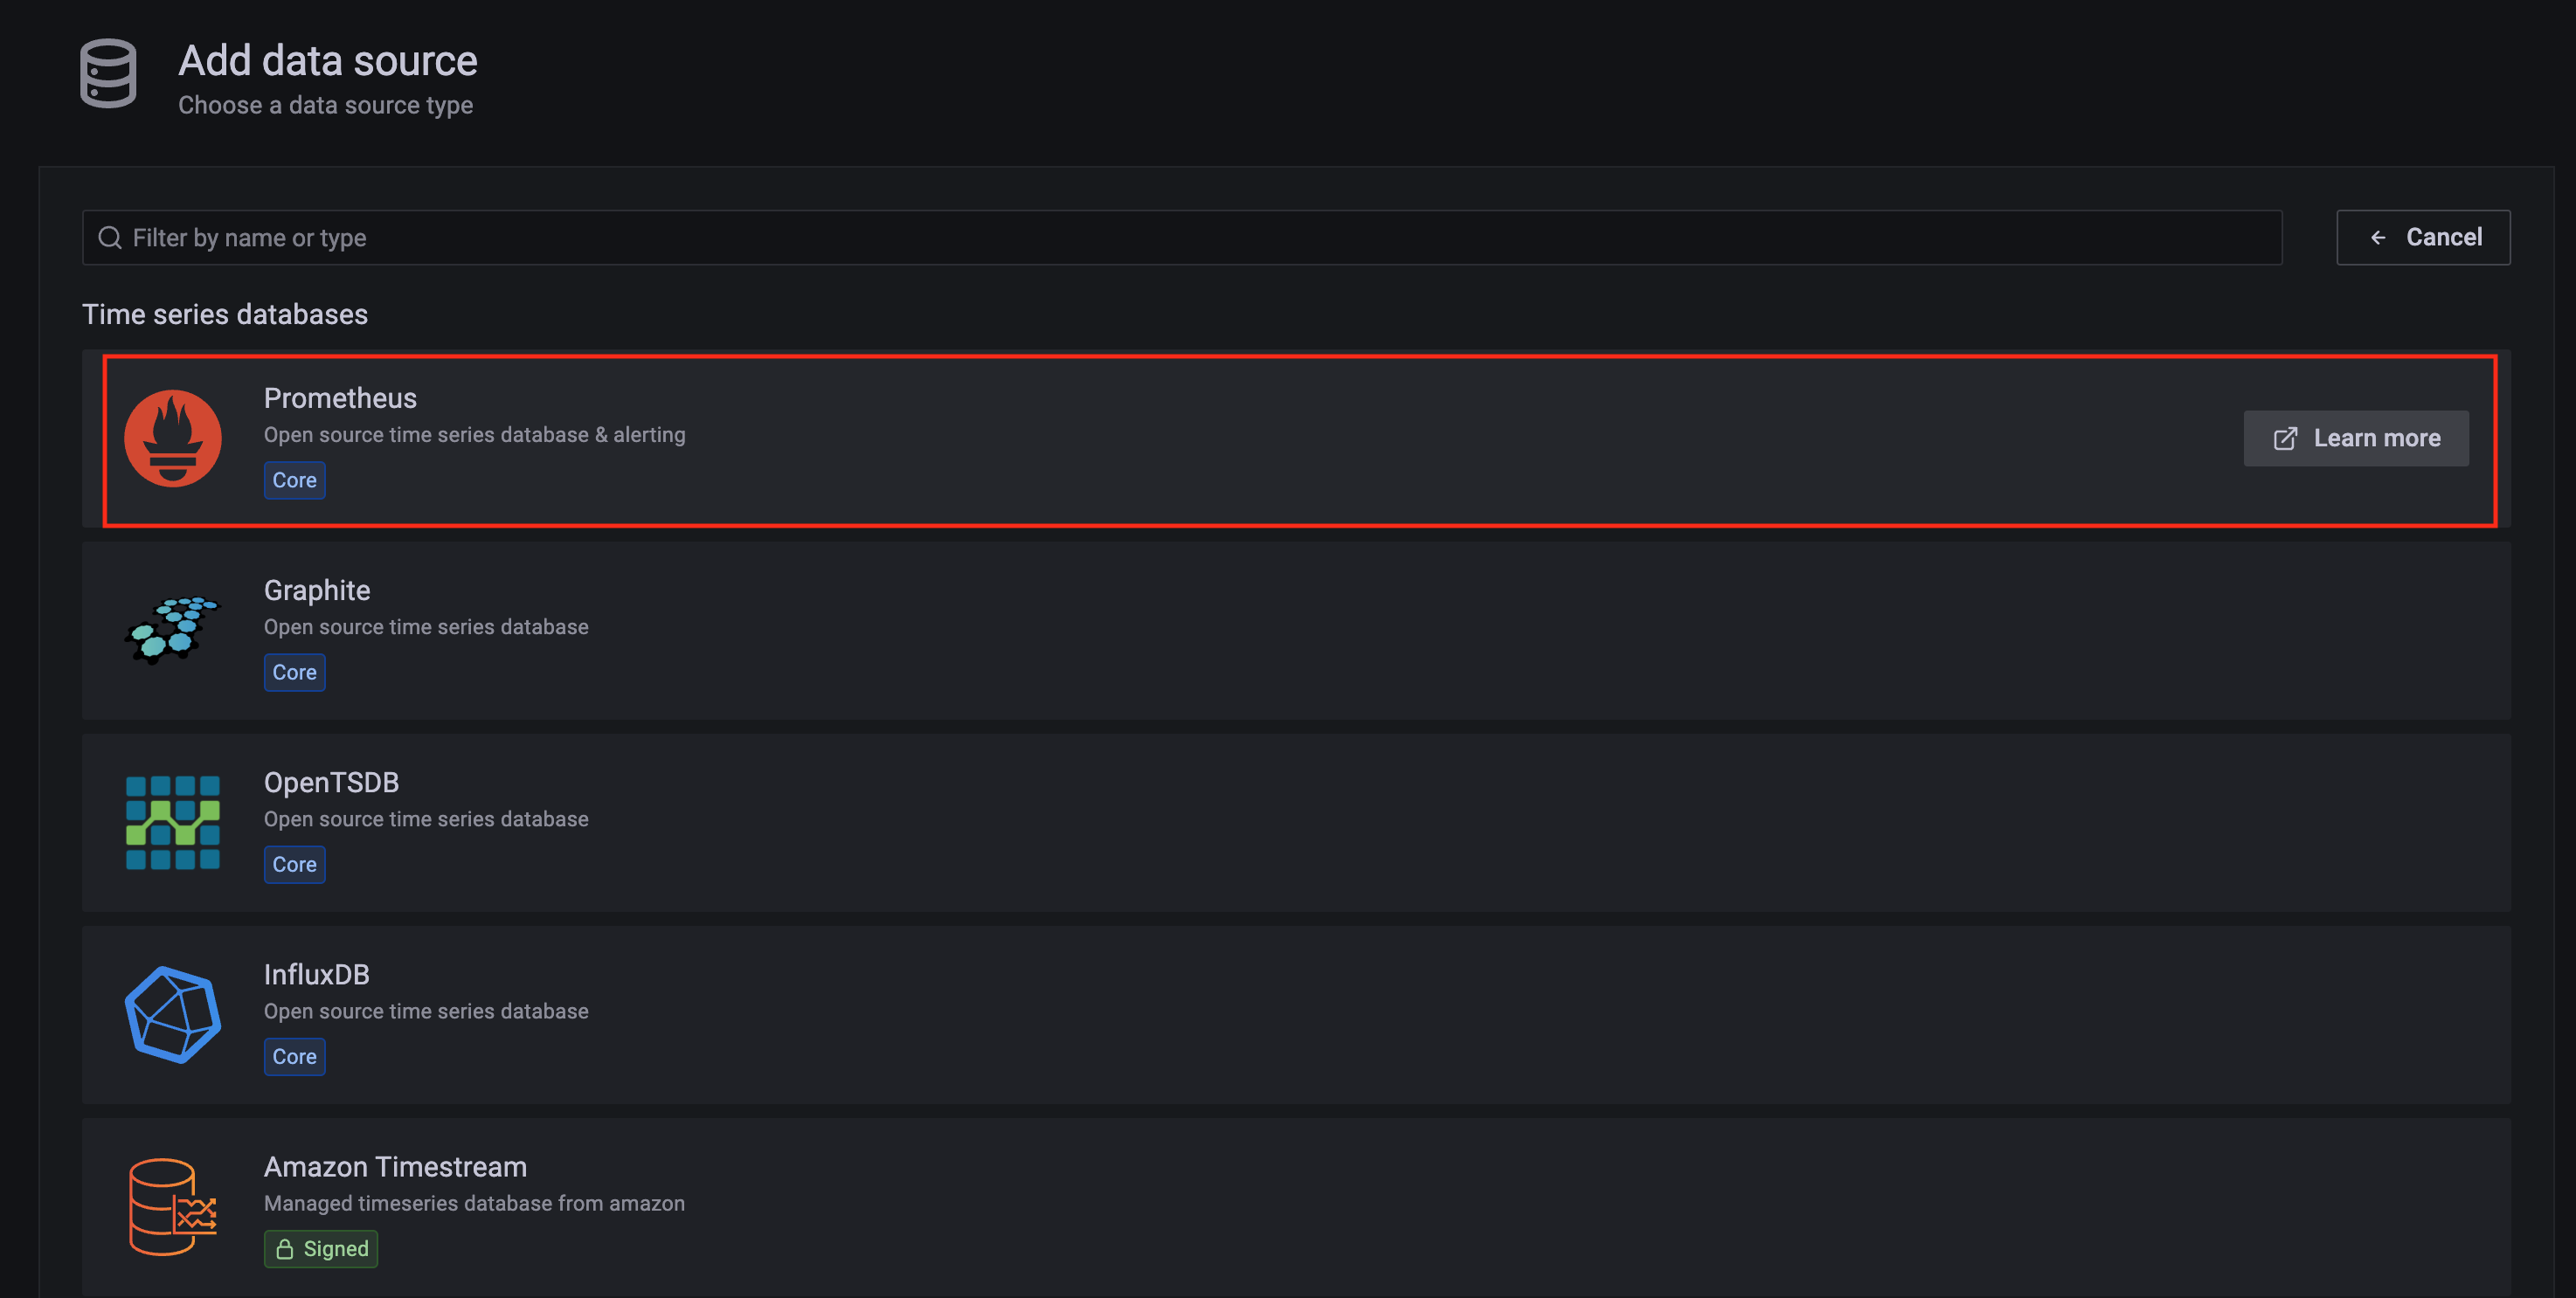
-
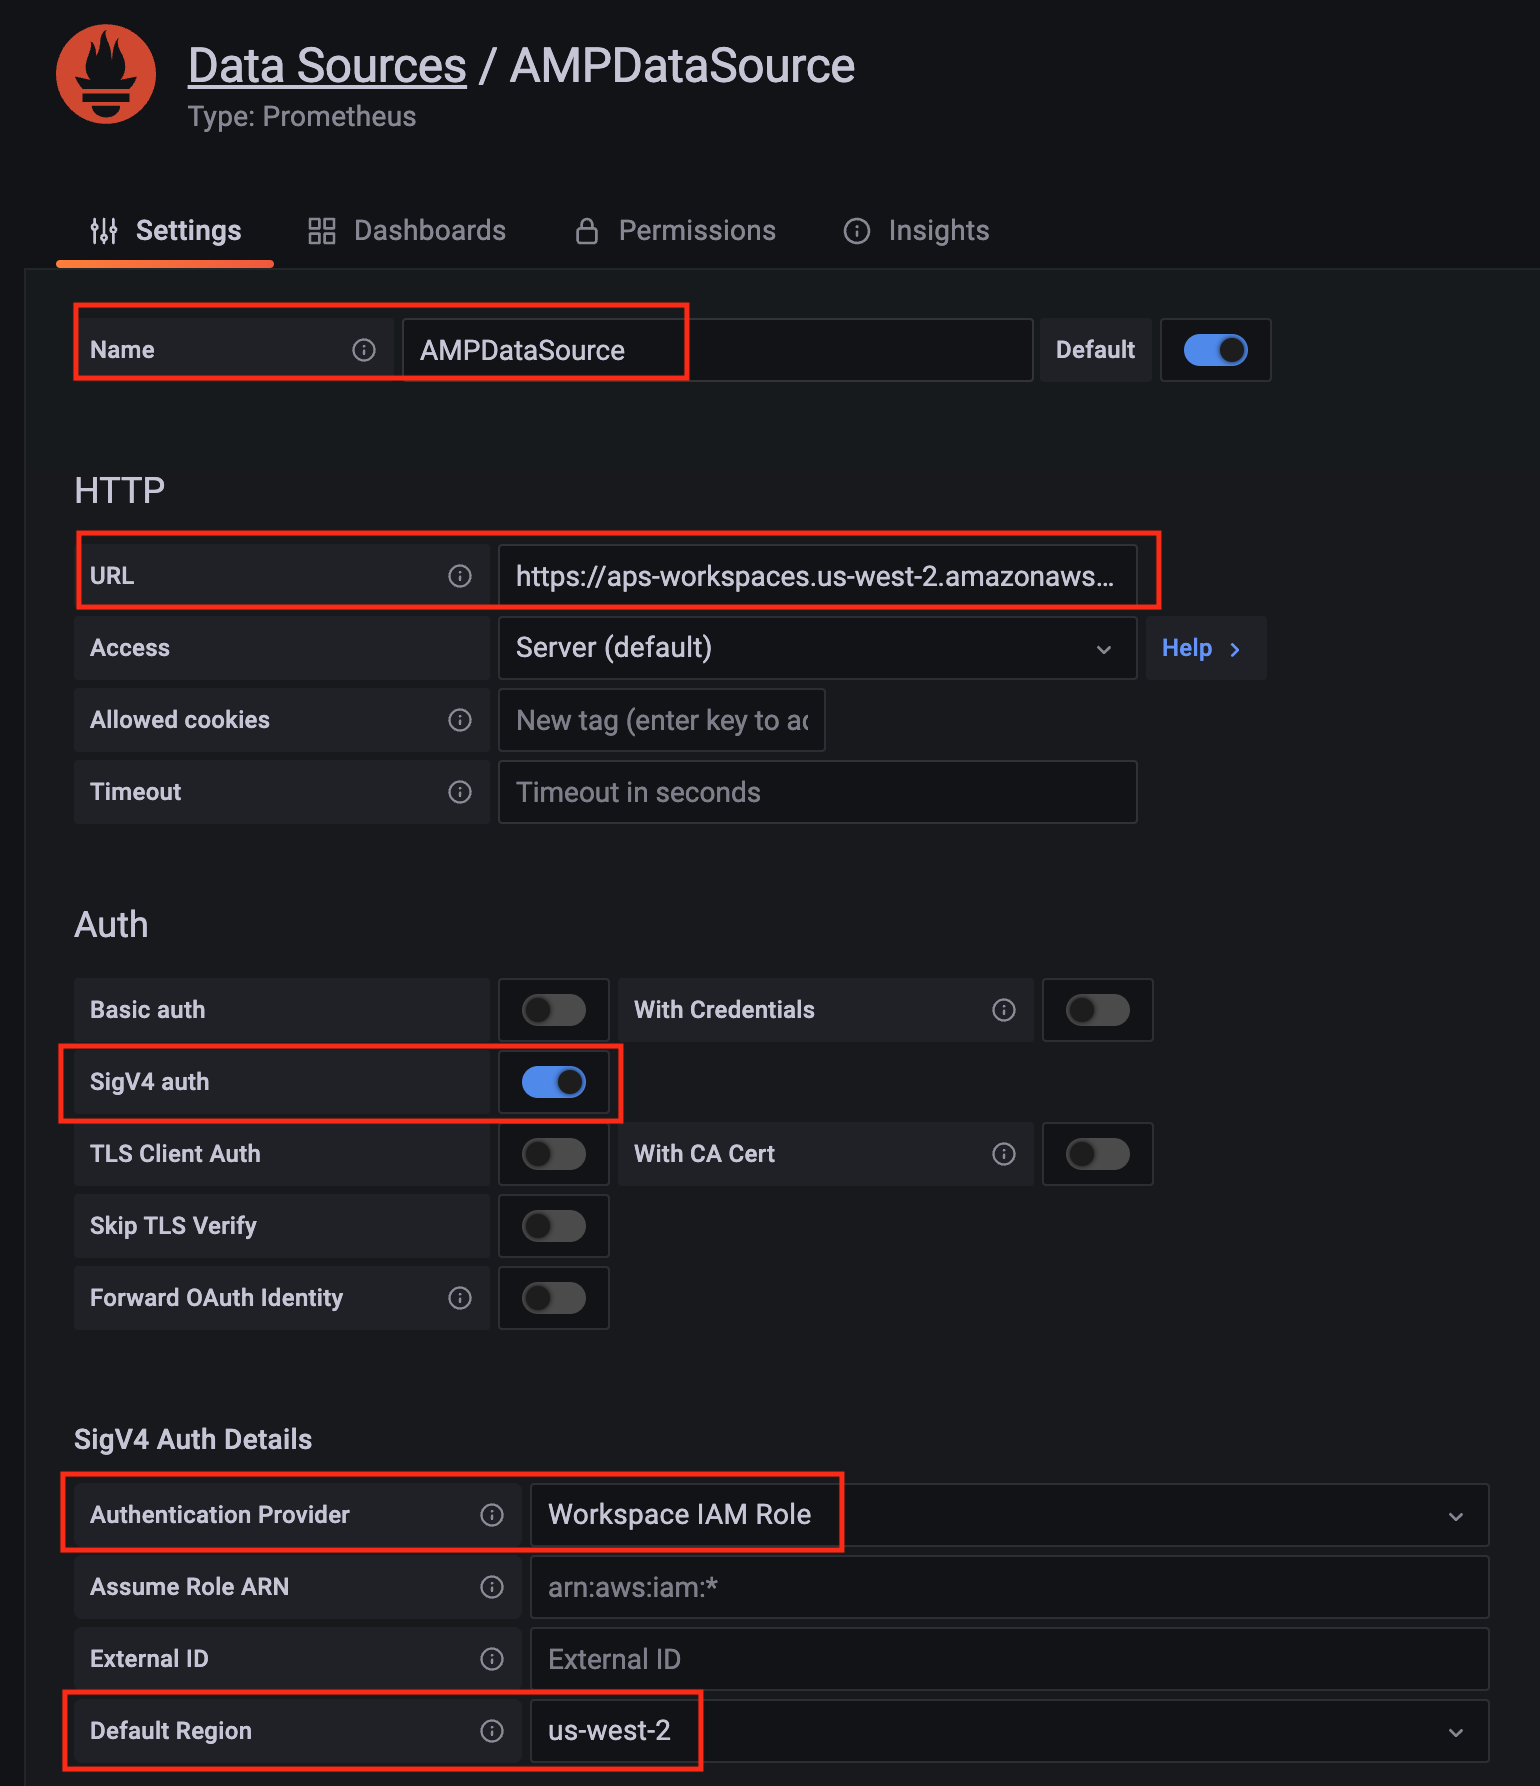
Configure Prometheus data source with the following details:
- Name:
AMPDataSourceas an example. - URL: add the AMP workspace remote write URL without the
api/v1/remote_writeat the end. - SigV4 auth: enable.
- Under the SigV4 Auth Details section:
- Authentication Provider: choose
Workspace IAM Role; - Default Region: choose
us-west-2(where you created the AMP workspace)
- Authentication Provider: choose
- Select the
Save and test, and a notificationdata source is workingshould be displayed.
- Name:
-
Import a dashboard template by clicking on the plus (+) sign on the left navigation bar. In the Import screen, type
3119in theImport via grafana.comtextbox and selectImport. From the dropdown at the bottom, selectAMPDataSourceand selectImport.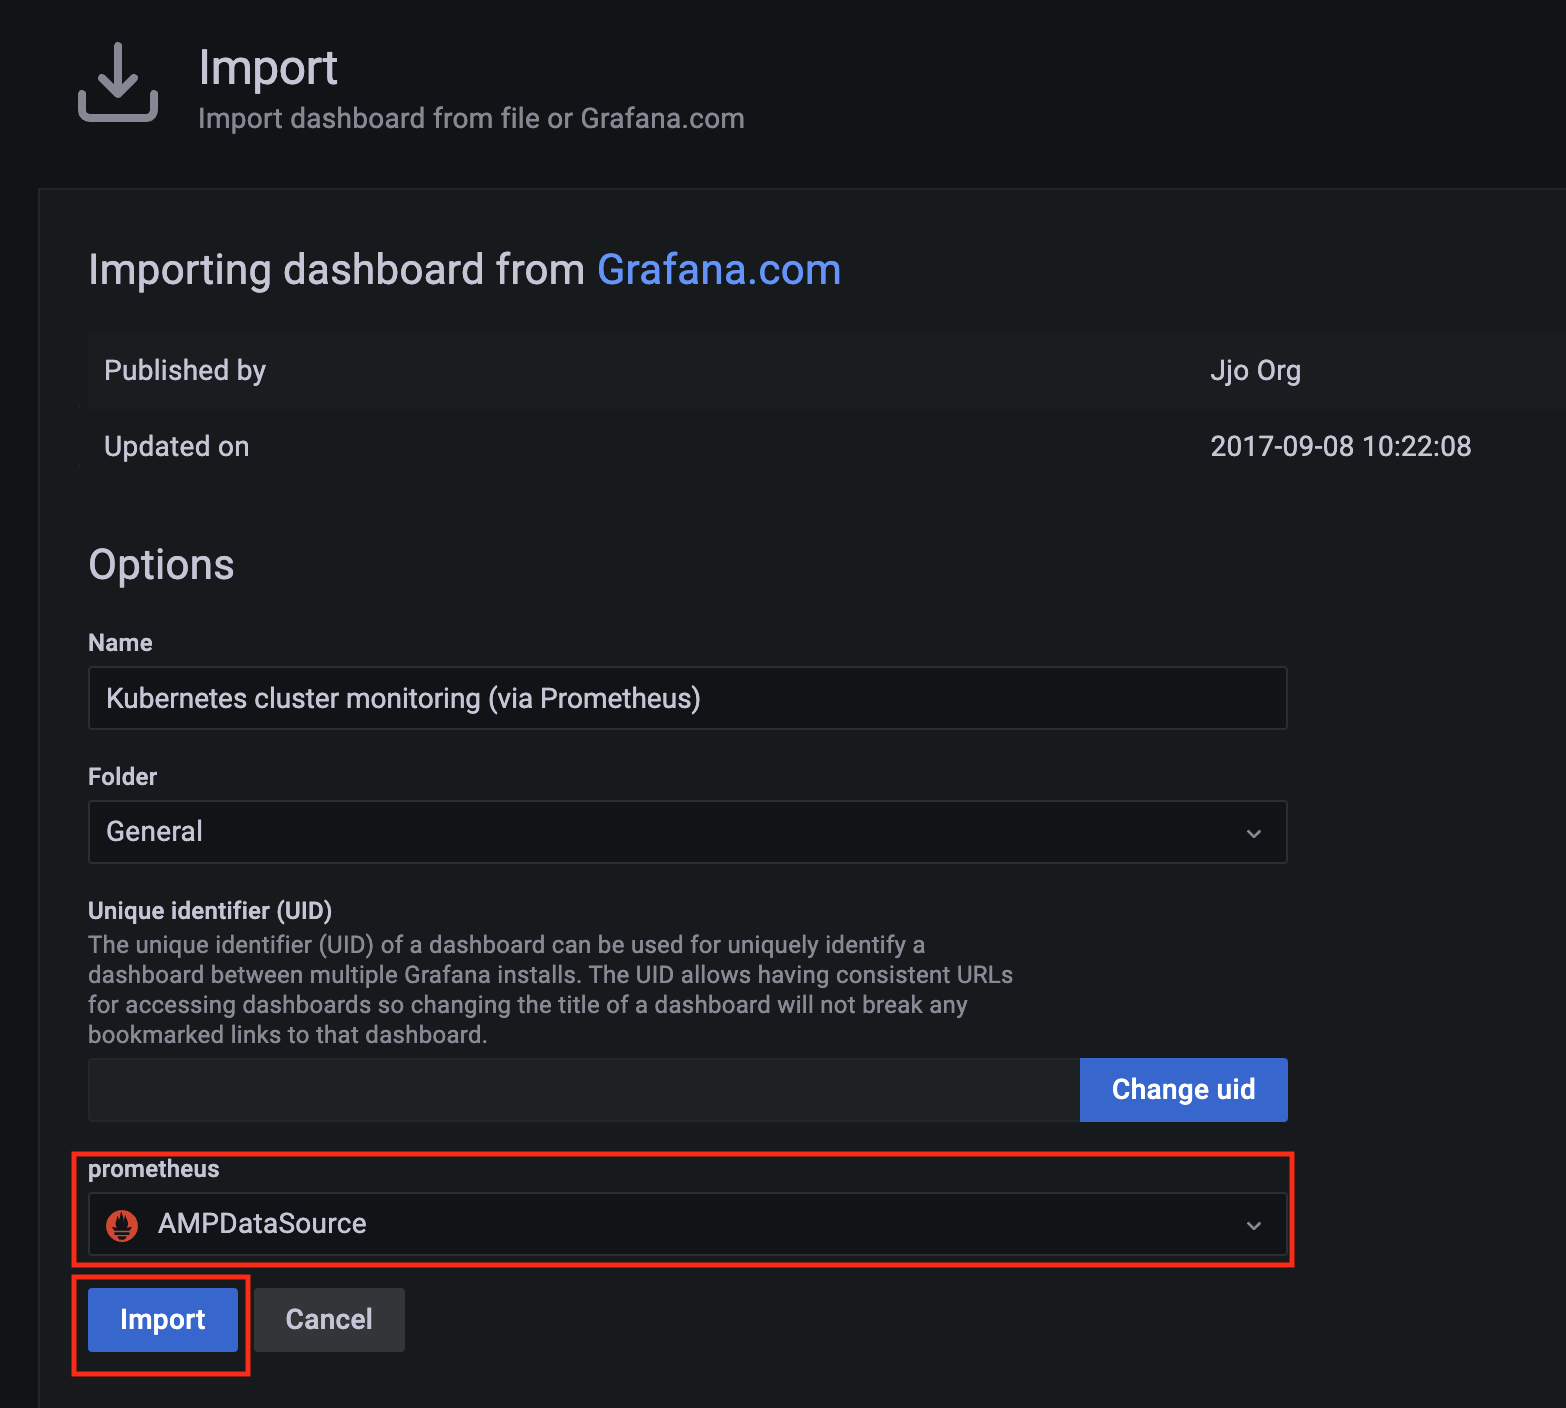
-
A
Kubernetes cluster monitoring (via Prometheus)dashboard will be displayed.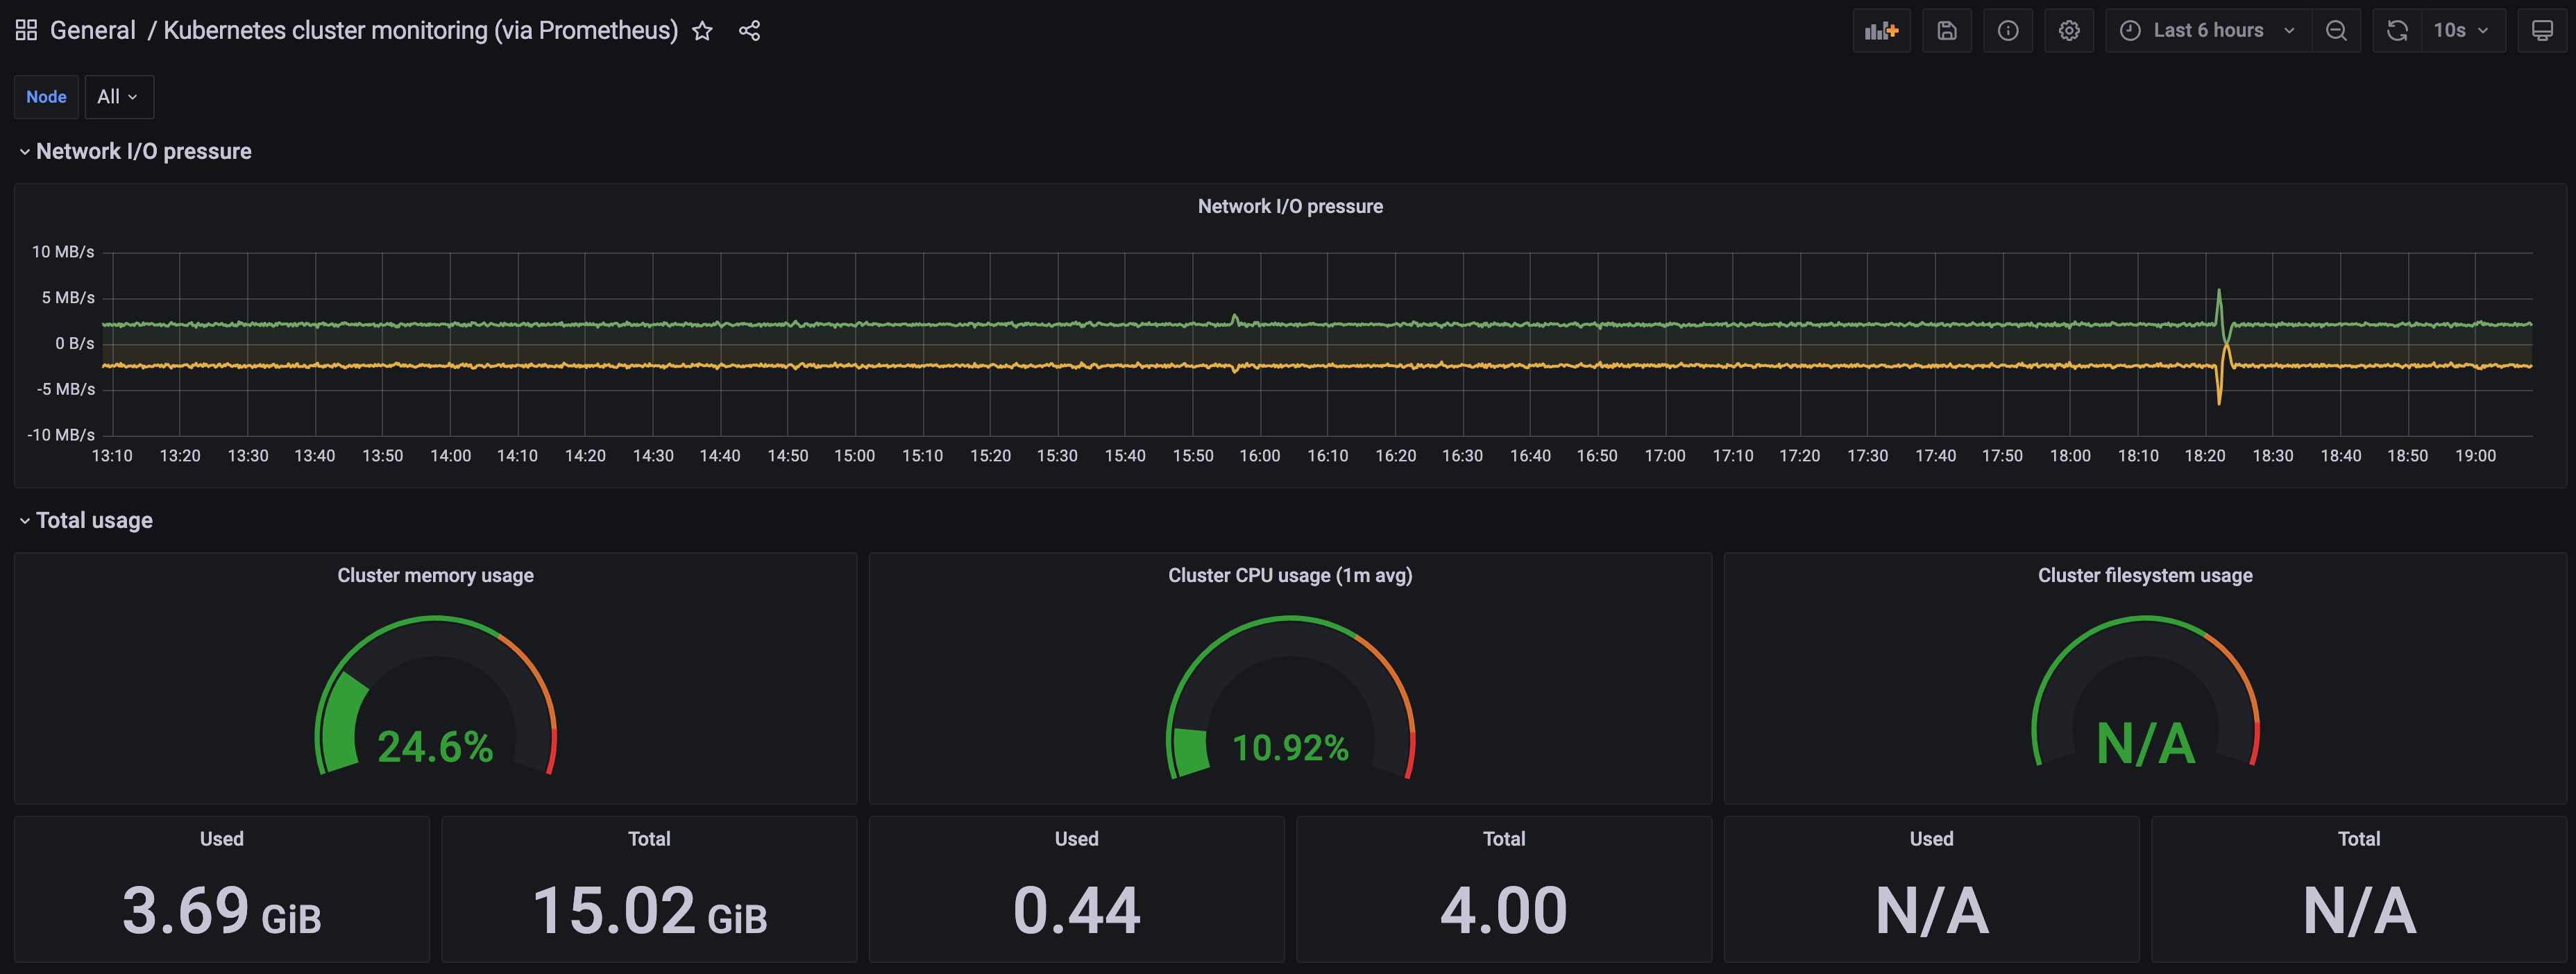
3 - Harbor use cases
Important
To install Harbor package, please follow the installation guide.Proxy a public Amazon Elastic Container Registry (ECR) repository
This use case is to use Harbor to proxy and cache images from a public ECR repository, which helps limit the amount of requests made to a public ECR repository, avoiding consuming too much bandwidth or being throttled by the registry server.
-
Login
Log in to the Harbor web portal with the default credential as shown below
admin
Harbor12345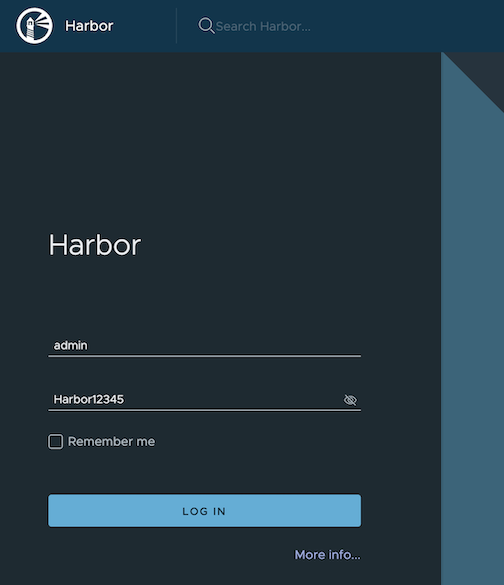
-
Create a registry proxy
Navigate to
Registrieson the left panel, and then click onNEW ENDPOINTbutton. ChooseDocker Registryas the Provider, and enterpublic-ecras the Name, and enterhttps://public.ecr.aws/as the Endpoint URL. Save it by clicking on OK.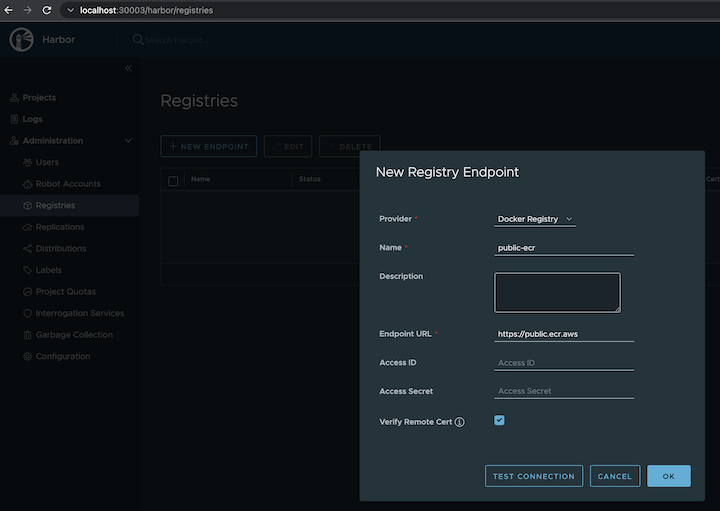
-
Create a proxy project
Navigate to
Projectson the left panel and click on theNEW PROJECTbutton. Enterproxy-projectas the Project Name, checkPublic access level, and turn on Proxy Cache and choosepublic-ecrfrom the pull-down list. Save the configuration by clicking on OK.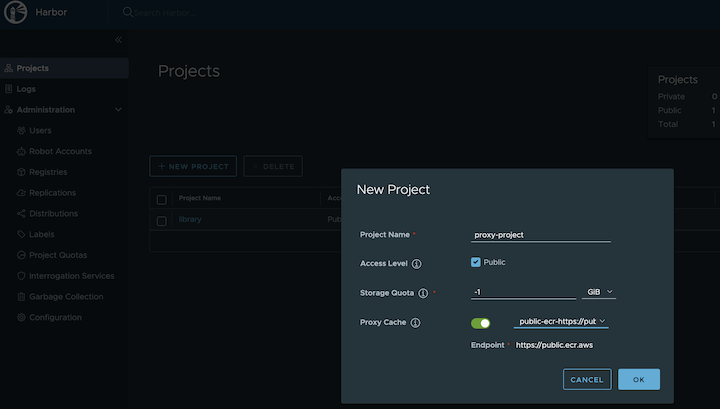
-
Pull images
Note
harbor.eksa.demo:30003should be replaced with whateverexternalURLis set to in the Harbor package YAML file.
docker pull harbor.eksa.demo:30003/proxy-project/cloudwatch-agent/cloudwatch-agent:latest
Proxy a private Amazon Elastic Container Registry (ECR) repository
This use case is to use Harbor to proxy and cache images from a private ECR repository, which helps limit the amount of requests made to a private ECR repository, avoiding consuming too much bandwidth or being throttled by the registry server.
-
Login
Log in to the Harbor web portal with the default credential as shown below
admin
Harbor12345
-
Create a registry proxy
In order for Harbor to proxy a remote private ECR registry, an IAM credential with necessary permissions need to be created. Usually, it follows three steps:
-
Policy
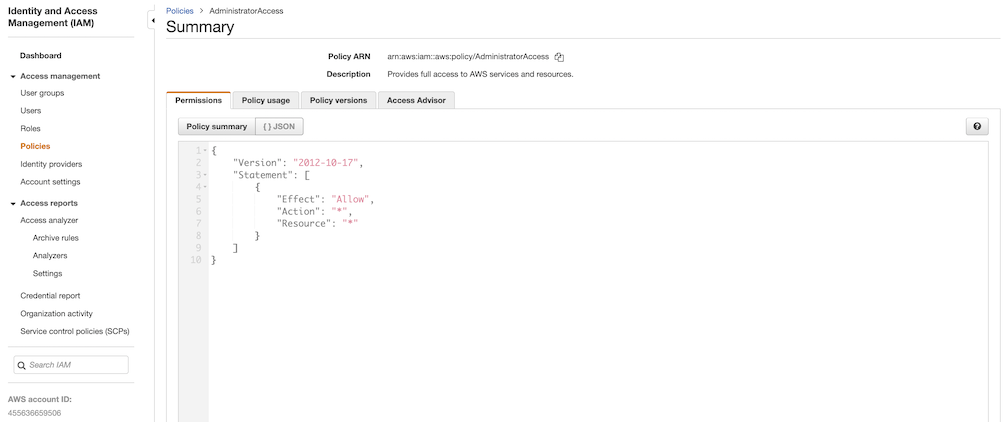
This is where you specify all necessary permissions. Please refer to private repository policies , IAM permissions for pushing an image and ECR policy examples to figure out the minimal set of required permissions.
For simplicity, the build-in policy AdministratorAccess is used here.
-
User group
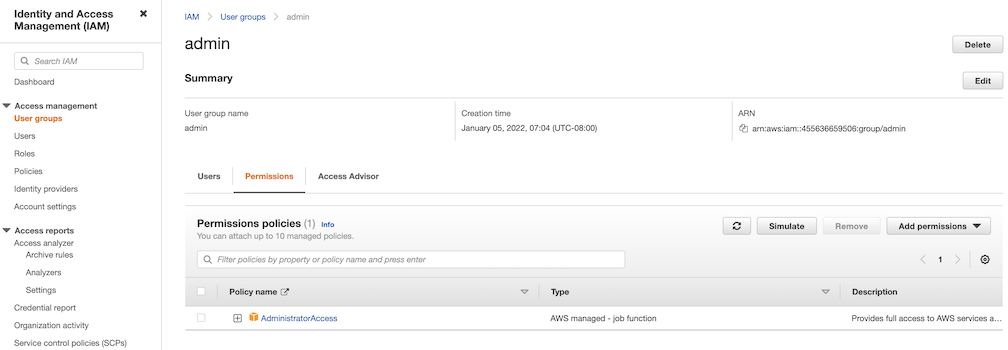
This is an easy way to manage a pool of users who share the same set of permissions by attaching the policy to the group.
-
User
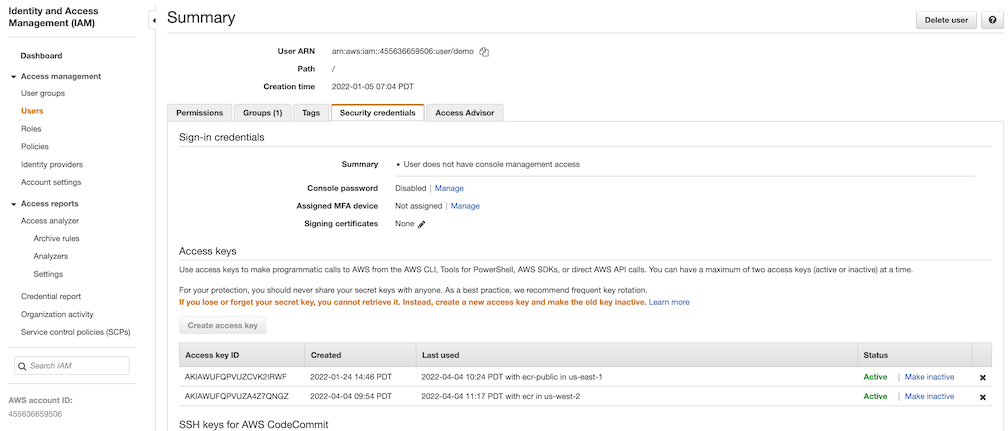
Create a user and add it to the user group. In addition, please navigate to Security credentials to generate an access key. Access keys consists of two parts: an access key ID and a secret access key. Please save both as they are used in the next step.
Navigate to
Registrieson the left panel, and then click onNEW ENDPOINTbutton. ChooseAws ECRas Provider, and enterprivate-ecras Name,https://[ACCOUNT NUMBER].dkr.ecr.us-west-2.amazonaws.com/as Endpoint URL, use the access key ID part of the generated access key as Access ID, and use the secret access key part of the generated access key as Access Secret. Save it by click on OK.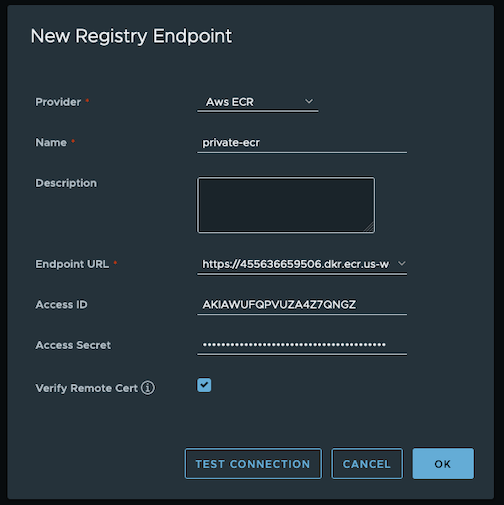
-
-
Create a proxy project
Navigate to
Projectson the left panel and click onNEW PROJECTbutton. Enterproxy-private-projectas Project Name, checkPublic access level, and turn on Proxy Cache and chooseprivate-ecrfrom the pull-down list. Save the configuration by clicking on OK.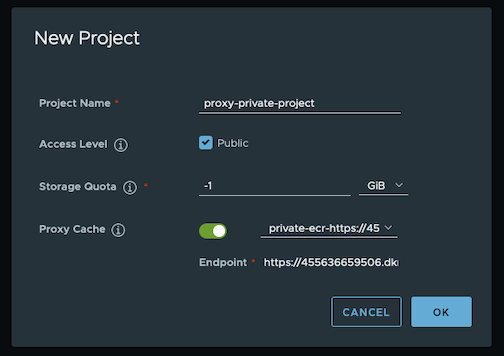
-
Pull images
Create a repository in the target private ECR registry

Push an image to the created repository
docker pull alpine
docker tag alpine [ACCOUNT NUMBER].dkr.ecr.us-west-2.amazonaws.com/alpine:latest
docker push [ACCOUNT NUMBER].dkr.ecr.us-west-2.amazonaws.com/alpine:latest
Note
harbor.eksa.demo:30003should be replaced with whateverexternalURLis set to in the Harbor package YAML file.
docker pull harbor.eksa.demo:30003/proxy-private-project/alpine:latest
Repository replication from Harbor to a private Amazon Elastic Container Registry (ECR) repository
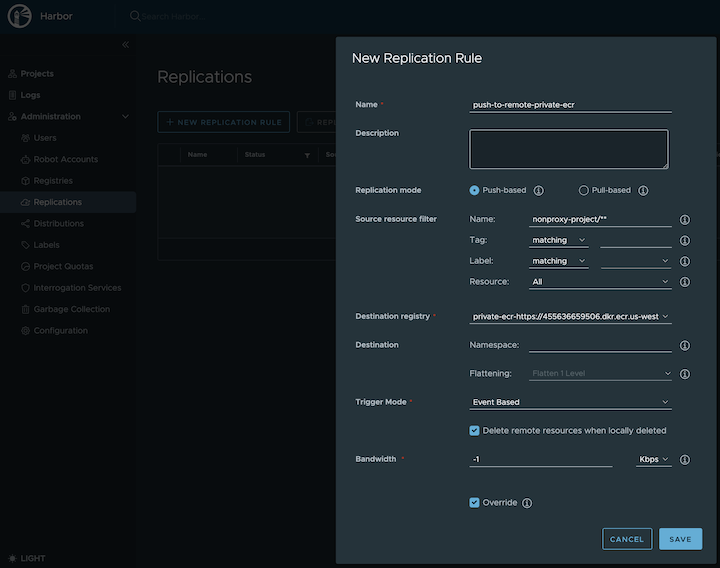
This use case is to use Harbor to replicate local images and charts to a private ECR repository in push mode. When a replication rule is set, all resources that match the defined filter patterns are replicated to the destination registry when the triggering condition is met.
-
Login
Log in to the Harbor web portal with the default credential as shown below
admin
Harbor12345
-
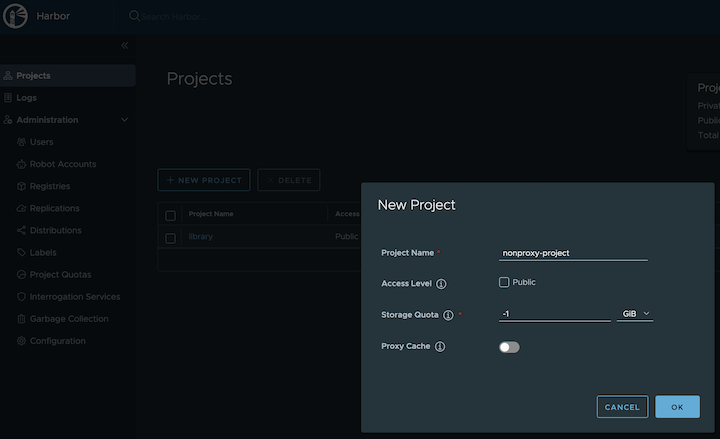
Create a nonproxy project
-
Create a registry proxy
In order for Harbor to proxy a remote private ECR registry, an IAM credential with necessary permissions need to be created. Usually, it follows three steps:
-
Policy
This is where you specify all necessary permissions. Please refer to private repository policies , IAM permissions for pushing an image and ECR policy examples to figure out the minimal set of required permissions.
For simplicity, the build-in policy AdministratorAccess is used here.

-
User group
This is an easy way to manage a pool of users who share the same set of permissions by attaching the policy to the group.

-
User
Create a user and add it to the user group. In addition, please navigate to Security credentials to generate an access key. Access keys consists of two parts: an access key ID and a secret access key. Please save both as they are used in the next step.

Navigate to
Registrieson the left panel, and then click on theNEW ENDPOINTbutton. ChooseAws ECRas the Provider, and enterprivate-ecras the Name,https://[ACCOUNT NUMBER].dkr.ecr.us-west-2.amazonaws.com/as the Endpoint URL, use the access key ID part of the generated access key as Access ID, and use the secret access key part of the generated access key as Access Secret. Save it by clicking on OK.
-
-
Create a replication rule
-
Prepare an image
Note
harbor.eksa.demo:30003should be replaced with whateverexternalURLis set to in the Harbor package YAML file.
docker pull alpine docker tag alpine:latest harbor.eksa.demo:30003/nonproxy-project/alpine:latest -
Authenticate with Harbor with the default credential as shown below
admin
Harbor12345
Note
harbor.eksa.demo:30003should be replaced with whateverexternalURLis set to in the Harbor package YAML file.
docker logout docker login harbor.eksa.demo:30003 -
Push images
Create a repository in the target private ECR registry

Note
harbor.eksa.demo:30003should be replaced with whateverexternalURLis set to in the Harbor package YAML file.
docker push harbor.eksa.demo:30003/nonproxy-project/alpine:latestThe image should appear in the target ECR repository shortly.

Set up trivy image scanner in an air-gapped environment
This use case is to manually import vulnerability database to Harbor trivy when Harbor is running in an air-gapped environment. All the following commands are assuming Harbor is running in the default namespace.
-
Configure trivy
TLS example with auto certificate generation
apiVersion: packages.eks.amazonaws.com/v1alpha1
kind: Package
metadata:
   name: my-harbor
   namespace: eksa-packages
spec:
   packageName: harbor
   config: |-
     secretKey: "use-a-secret-key"
     externalURL: https://harbor.eksa.demo:30003
     expose:
       tls:
         certSource: auto
         auto:
           commonName: "harbor.eksa.demo"
       trivy:
         skipUpdate: true
         offlineScan: true
Non-TLS example
apiVersion: packages.eks.amazonaws.com/v1alpha1
kind: Package
metadata:
   name: my-harbor
   namespace: eksa-packages
spec:
   packageName: harbor
   config: |-
     secretKey: "use-a-secret-key"
     externalURL: http://harbor.eksa.demo:30002
     expose:
       tls:
         enabled: false
     trivy:
       skipUpdate: true
       offlineScan: true
If Harbor is already running without the above trivy configurations, run the following command to update both
skipUpdateandofflineScankubectl edit statefulsets/harbor-helm-trivy -
Download the vulnerability database to your local host
Please follow oras installation instruction .
oras pull ghcr.io/aquasecurity/trivy-db:2 -a -
Upload database to trivy pod from your local host
kubectl cp db.tar.gz harbor-helm-trivy-0:/home/scanner/.cache/trivy -c trivy -
Set up database on Harbor trivy pod
kubectl exec -it harbor-helm-trivy-0 -c trivy bash
cd /home/scanner/.cache/trivy
mkdir db
mv db.tar.gz db
cd db
tar zxvf db.tar.gz